Ask one question. Get the answer from every tool.
How much revenue did we lose from churned Stripe customers who never opened a HubSpot email?
clariBI joins Stripe + HubSpot, runs the analysis, shows you the chart. No SQL, no data team.
Your data sits in Stripe, Shopify, HubSpot, and Google Analytics. Real questions need answers from all of them. We make that one question instead of five dashboards.
Works with 90+ tools you already use · one click to connect.
No credit card required • 14-day free trial • Cancel anytime
Connect your favorite tools
175+ integrations via MCP, OAuth, and native database connectors. Read-only, one-click.
Sound Familiar?
We've Been There Too.
"I need to check 5 different dashboards to answer one question"
Revenue in Stripe, traffic in Google Analytics, customers in HubSpot. Getting the full picture takes forever.
"Our weekly report takes 2 days to put together"
Copy-pasting between spreadsheets, fixing formulas, making sure numbers match. There has to be a better way.
"We don't have a data team, but we still need answers"
You shouldn't need to hire specialists just to understand your own business data.
Questions you can finally answer:
"Which ad campaigns actually led to paying customers?"
Combines: Google Ads + Stripe + your CRM
"What's our real cost to acquire a customer?"
Combines: Ad spend + Stripe + operational costs
"Which products are most popular with our best customers?"
Combines: Shopify orders + customer segments + returns
"Will we hit our Q4 revenue target at current trajectory?"
Combines: Historical revenue + forecasting engine + driver discovery
These questions require data from multiple sources. We handle the hard part.
How It Works
Connect your tools, ask questions, get answers. No SQL, no coding, no waiting for someone else to run a report.
1. Connect Your Tools
Connect Google Analytics, Google Ads, Meta Ads, Jira and your databases via OAuth, plus 30 more vendors (Stripe, HubSpot, Linear, Notion, PostHog, Klaviyo, Sentry, Vercel and more) through clariBI's MCP catalog. CSV and Excel upload covers everything else.
See all integrations →2. Ask Questions
Type what you want to know in plain English. "What's driving our revenue growth?" "Which customers are churning?"
See how it works →3. Get Answers
See charts, insights, and explanations pulled from all your connected sources. Save them to dashboards you can share.
See example dashboards →Start with Templates
Not sure where to start? We have ready-made reports for SaaS metrics, ecommerce, marketing ROI, and more.
Browse templates →Forecast Ahead
Project any metric ahead, find the drivers behind it, and flag spikes and structural changes. Deterministic, with a prediction band and FDR-controlled driver discovery.
See forecasting →Share with Your Team
Give your team access to the reports they need. Everyone stays on the same page without endless Slack threads.
Learn more →See clariBI in Action
A real look inside the platform powering smarter business decisions
Perfect for Your Business
Explore common use cases and see how clariBI can help your business
SaaS Startups
Track MRR, churn, CAC, and user engagement without a data team
Ecommerce
Optimize inventory, understand customer behavior, boost sales
Marketing Agencies
Prove ROI to clients with beautiful, automated reports
Small Businesses
Make smarter decisions with your sales, financial, and operational data
Built for Teams Without a Data Team
We built clariBI because we were tired of the same problems. Here's what we focused on.
One Source of Truth
Stop jumping between dashboards. See your sales, marketing, and operations data side by side for the first time.
Minutes, Not Days
That weekly report that takes you all day? It updates itself now. Ask follow-up questions on the fly.
No Special Skills Needed
Type questions like you'd ask a colleague. No SQL, no formulas, no "can you export that to CSV?"
Simple, Transparent Pricing
Start with a 14-day free trial, then pay as you grow. No hidden fees, no surprises.
Starter
Perfect for small teams
- 10 data sources
- 500 AI credits/month
- 3 team members
- MCP integrations (Stripe, HubSpot, Linear and 27 more)
Professional
For growing businesses
- 50 data sources
- 1,500 AI credits/month
- 15 team members + RBAC
- Scheduled reports + audit log
Enterprise
For large organizations
- 100 data sources, 100 users
- 5,000 AI credits/month
- SAML SSO + audit export
Resources to dig deeper
Practical playbooks for SaaS, e-commerce, and ops teams — plus the help center if you're already setting up clariBI.
From the blog
All posts →- clariBI Forecasting: Project Any Metric Ahead, And Find What's Driving It
- clariBI Now Runs as an MCP Server: Sign Up, Upload Data, and Run Analyses From Claude Desktop or Cursor
- Snowflake vs. BigQuery vs. Postgres for Analytics: When Each Wins
- Why Modern BI Still Hasn’t Killed the Spreadsheet
- Migrating From Excel-Based Reporting to a Real BI Tool
- Picking Your First BI Tool as a 10-Person Startup
- clariBI vs. Tableau: A Practical Comparison
- clariBI vs. Looker: When Each Wins
Help center
Browse all articles →- MCP Server Integrations
- Manual Data Import Guides
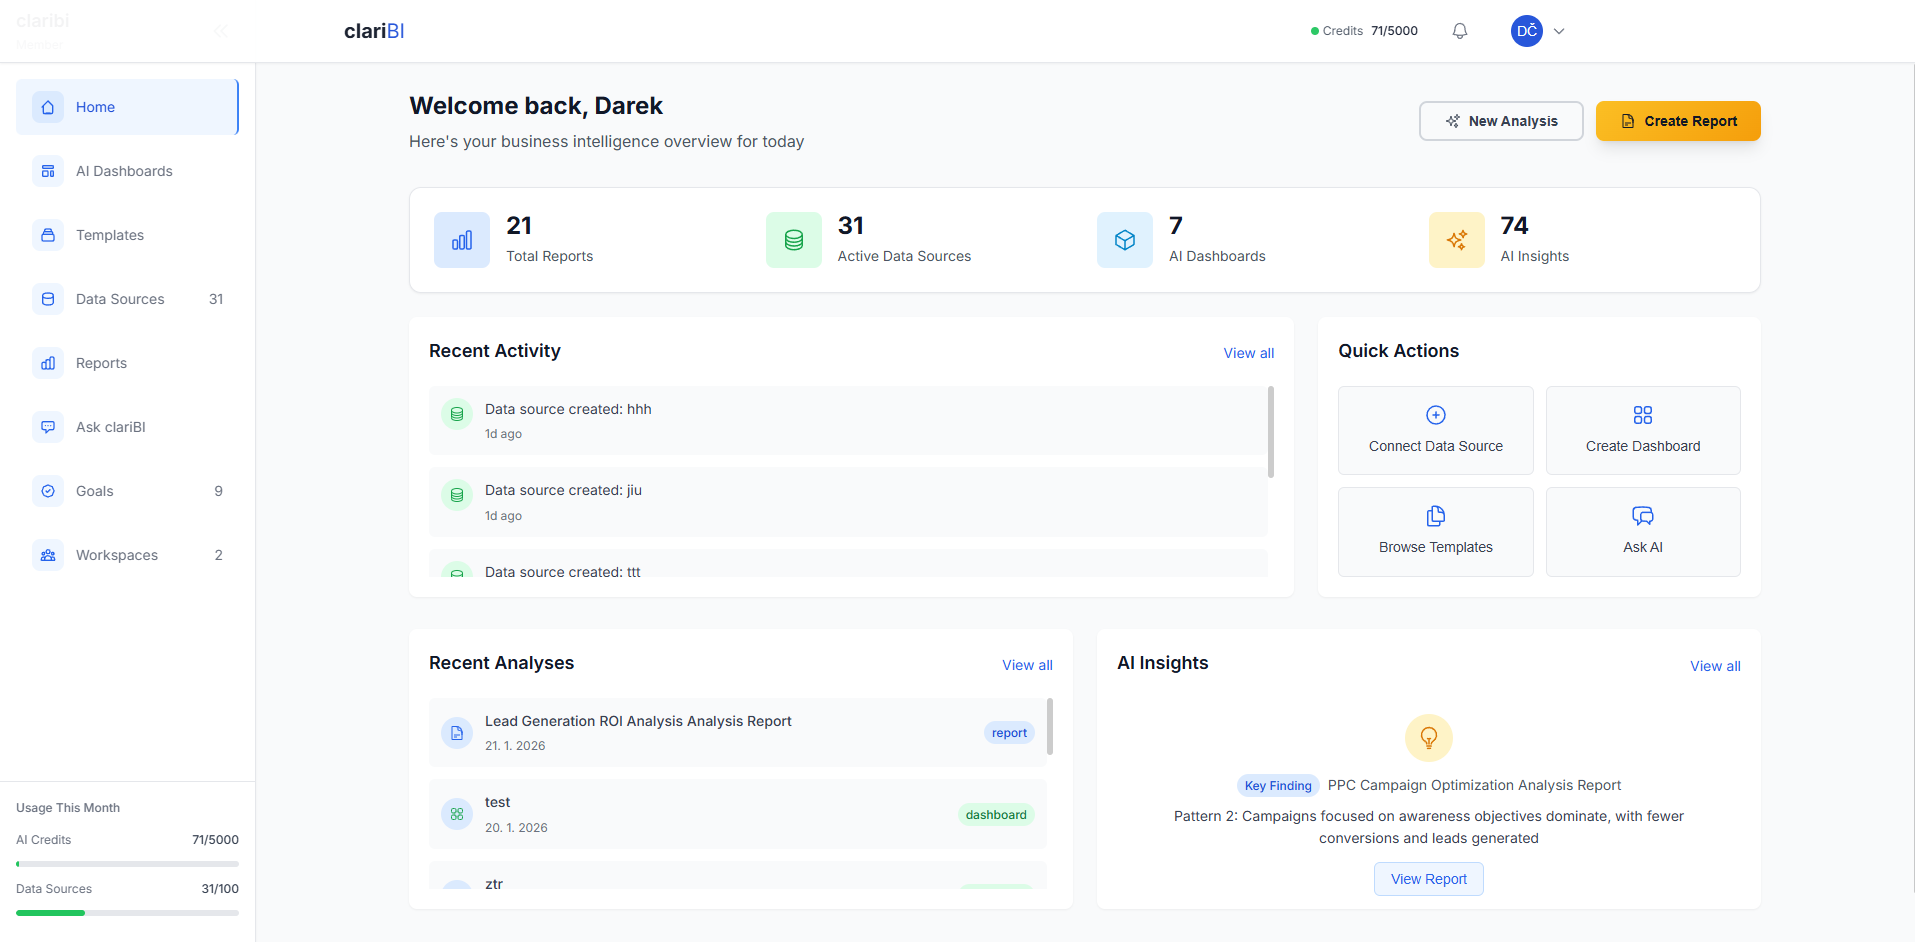
- Understanding the Home Dashboard: Every Section Explained
- Getting Started with clariBI: Your First Dashboard
- Data Source Errors: Every Error Message and How to Fix It
- Dashboard Builder: Widgets, Layout, and Configuration
- Widget Types: When to Use Each One
- 30 Example Questions That Get Good Results
Integrate clariBI from your own code or your LLM client
Two integration surfaces and two official SDKs. Pick whichever shape fits the work.
MCP Server
Learn more →Use clariBI from Claude Desktop, Cursor, ChatGPT, or any spec-compliant Model Context Protocol client. Sign up users, upload CSV / Excel / JSON / PDF, ingest from public URLs, hand off to Google Ads or Jira via OAuth, run natural-language analyses, and generate reports. 19 tools, OAuth 2.1 with Dynamic Client Registration plus API keys, streamable HTTP and SSE transports.
REST API
Learn more →Programmatic access to dashboards, reports, data sources, and usage. JSON over HTTPS, JWT or API key auth, per-tier rate limits, an interactive OpenAPI explorer at /api/v1/docs/. Available on Professional and Enterprise plans.
SDKs
SDK docs →Codegen-driven Python and TypeScript clients wrap the MCP server's JSON-RPC transport. Method signatures are produced from the live tool catalog at build time, so the typed surface never drifts from the server.
pip install claribi-mcp
Requires Python 3.10 or later. Distributed under the MIT license. View on PyPI.
npm install @claribicom/mcp
Requires Node.js 18 or later. ESM and CJS bundles, full type declarations. View on npm.
Free tools and honest comparisons
Run the math without spreadsheets, or see how clariBI stacks up against the alternatives small SaaS teams actually evaluate.
Free calculators
All calculators →- CAC CalculatorBlended and paid-channel customer acquisition cost.
- LTV CalculatorMargin-adjusted lifetime value, with benchmarks.
- MRR CalculatorNet new MRR, Quick Ratio, and NRR in one view.
- Churn Rate CalculatorCustomer churn and revenue churn, separately.
- Rule of 40 CalculatorGrowth rate plus profit margin, with verdict.
clariBI vs. alternatives
All comparisons →- clariBI vs. ChartMogulSubscription metrics plus the broader business view.
- clariBI vs. BaremetricsBeyond billing data into ad spend and CRM.
- clariBI vs. MixpanelCross-source business analytics vs product events.
- clariBI vs. MetabaseManaged AI dashboards vs self-hosted open source.
- clariBI vs. ModePlain-English analytics vs SQL-first reporting.
Ready to See Your Whole Business in One Place?
Connect your first data source in under 5 minutes. Ask your first question right after.
No credit card required • Works with your existing tools • Cancel anytime