Quick Start Guide
Estimated reading time: 10 minutes
Want to go from zero to your first AI-generated insight in under 10 minutes? This guide walks you through the essential steps with no detours.
Prerequisites
- A modern web browser (Chrome, Firefox, Safari, or Edge)
- An email address for account creation
- Optionally: a CSV file or database credentials to connect
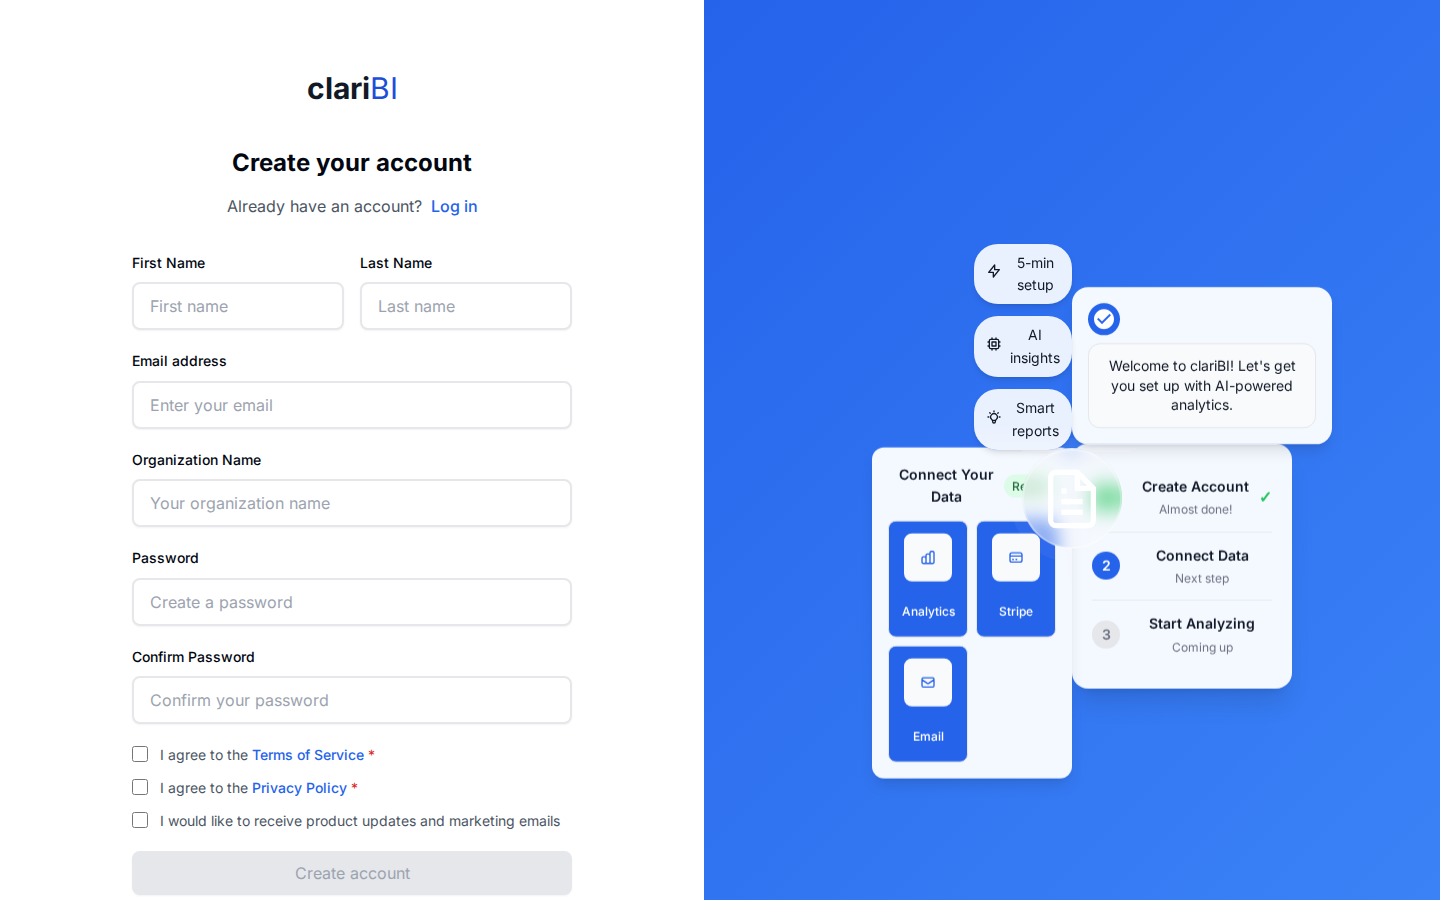
Step 1: Create Your Account
Go to claribi.com/app/register and fill in your first name, last name, email, organization name, and password (with confirmation). You will get a 14-day free trial with 50 AI credits, 3 data sources, 1 GB of storage, and 40 OCR pages. No credit card required. When the trial ends you can upgrade to a paid plan or continue on the Free tier with basic analytics and pre-computed data insights at no cost.
Step 2: Complete Onboarding
After registration, the onboarding wizard walks you through five steps: a Welcome screen, choosing an analysis template from 600+ options, connecting your data sources (or using sample data), running an AI analysis, and viewing your results. This guided flow takes a few minutes and produces your first AI-generated insights automatically.
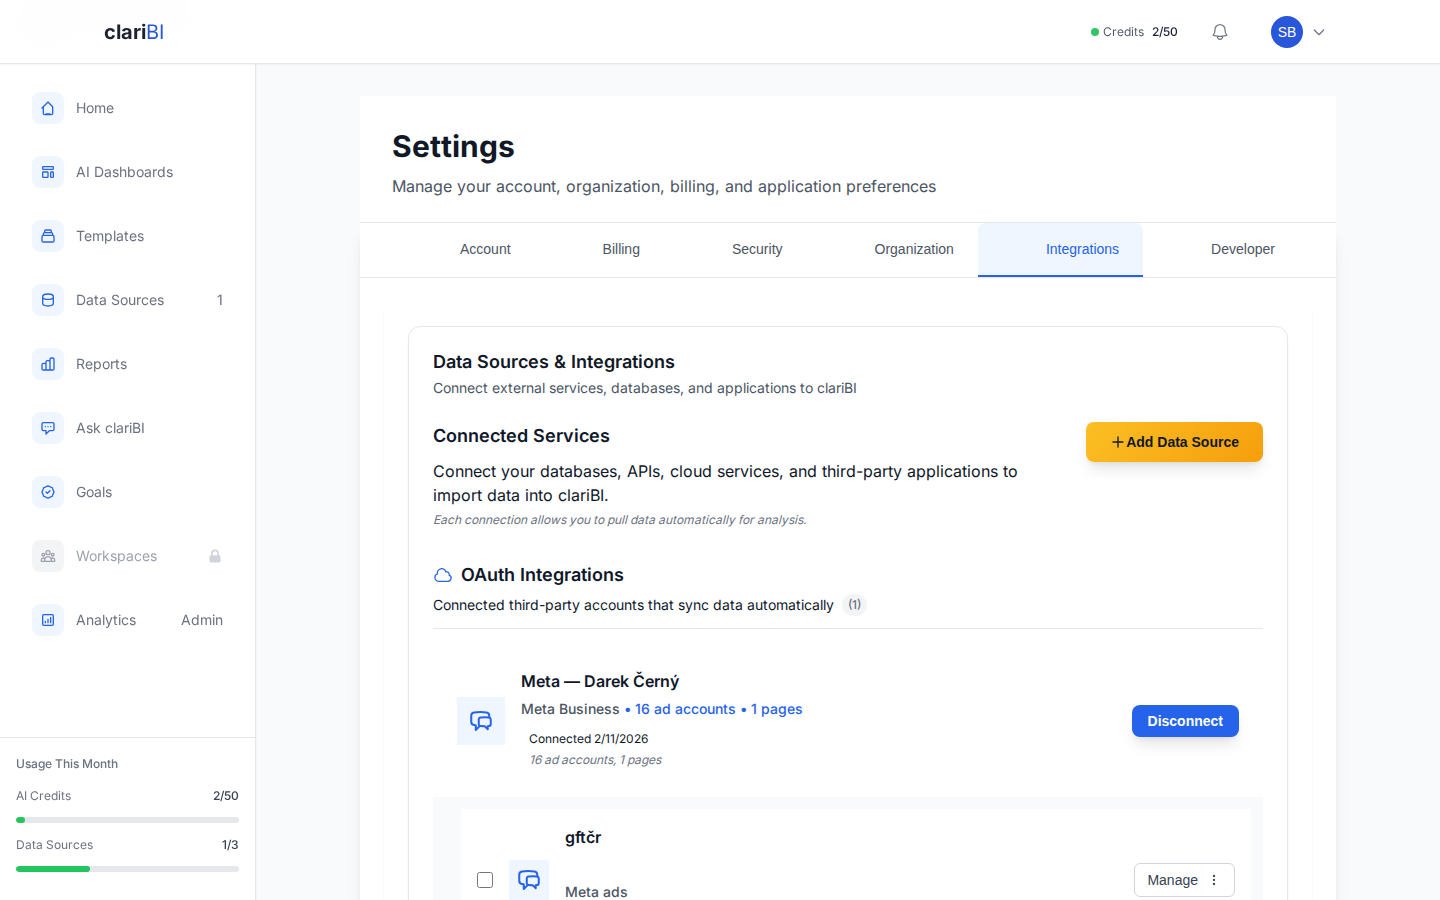
Step 3: Connect a Data Source
Navigate to Data Sources in the sidebar and click Add New Source. The fastest option is uploading a CSV or Excel file. You can also connect a PostgreSQL, MySQL, or other database directly. See Data Sources Overview for the full list.
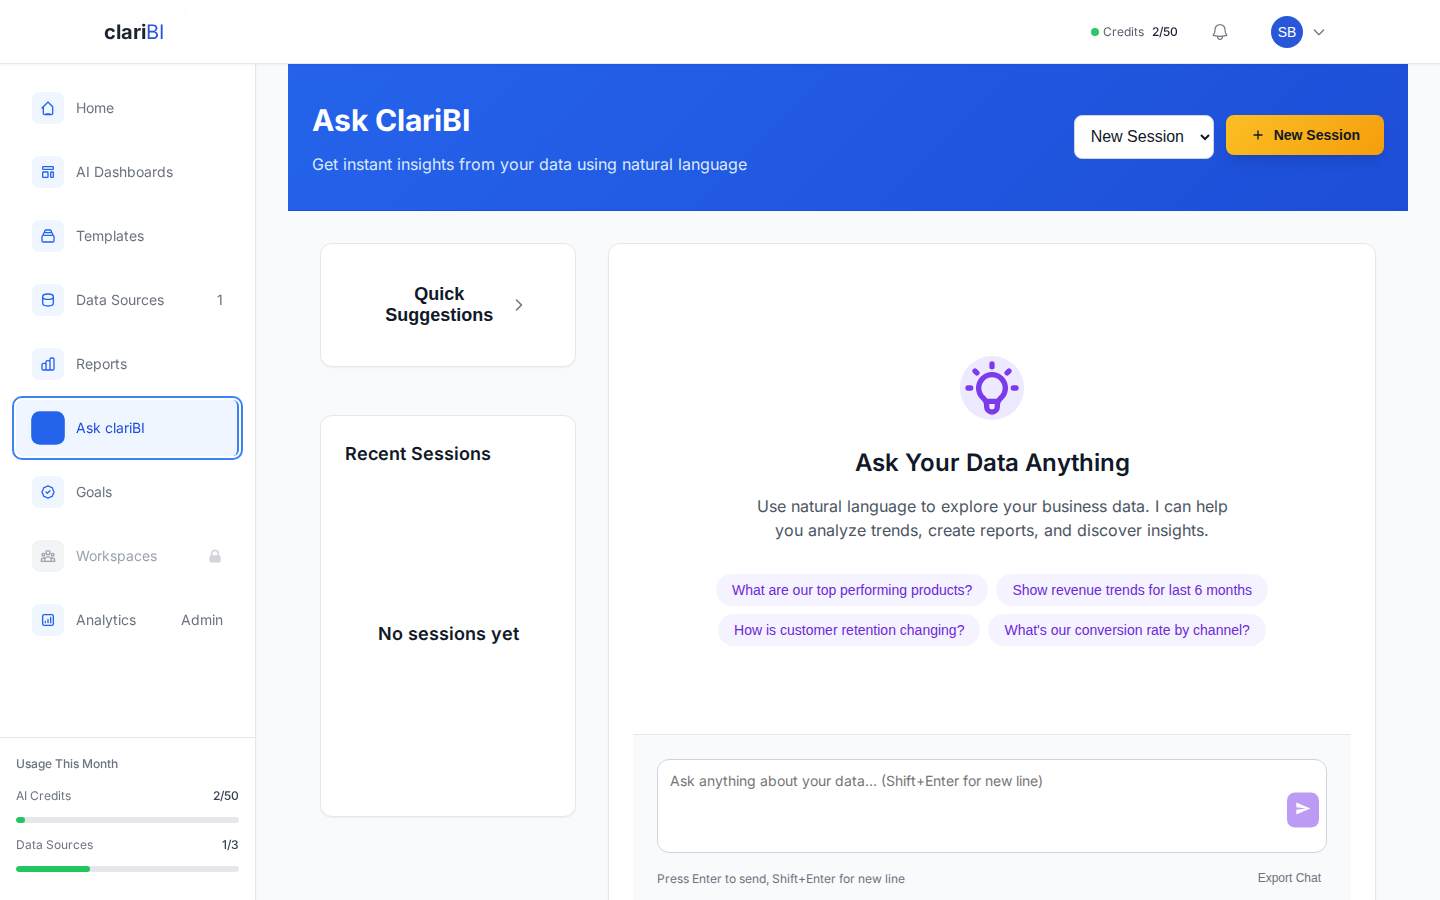
Step 4: Ask Your First Question
Go to Ask clariBI in the sidebar and type a plain-English question about your data. For example: "What were our top 5 products by revenue last month?" clariBI's AI will analyze your connected data and return an answer with a chart.
Step 5: Create a Dashboard
Head to AI Dashboards in the sidebar and click Create Dashboard. Pick a template or start blank. Add widgets like KPI cards, bar charts, and tables, then point them at your data source. Save and you have a live dashboard you can share with your team.
Pro Tip
If you are not sure which chart type to pick, use Ask clariBI to ask your question first. The AI will recommend the best visualization, and you can pin it to a dashboard from there.
What to Do Next
- Take the Interface Tour to learn where everything lives
- Build Your First Dashboard with a step-by-step tutorial
- Learn to Write Better AI Queries for more accurate results
- Compare Subscription Plans to see what each tier offers
You are ready
You now have data connected and your first AI-driven insight. From here, explore templates, build dashboards, and invite your team.
Ready to try clariBI?
Start for free or begin a 14-day trial with full AI-powered analytics. No credit card required.