Conversational Analytics
Estimated reading time: 15 minutes
Conversational Analytics is clariBI's natural language interface for querying your data. Type a question, get a chart and written analysis. No SQL needed.
Prerequisites
- At least one connected and synced data source
- Available AI credits
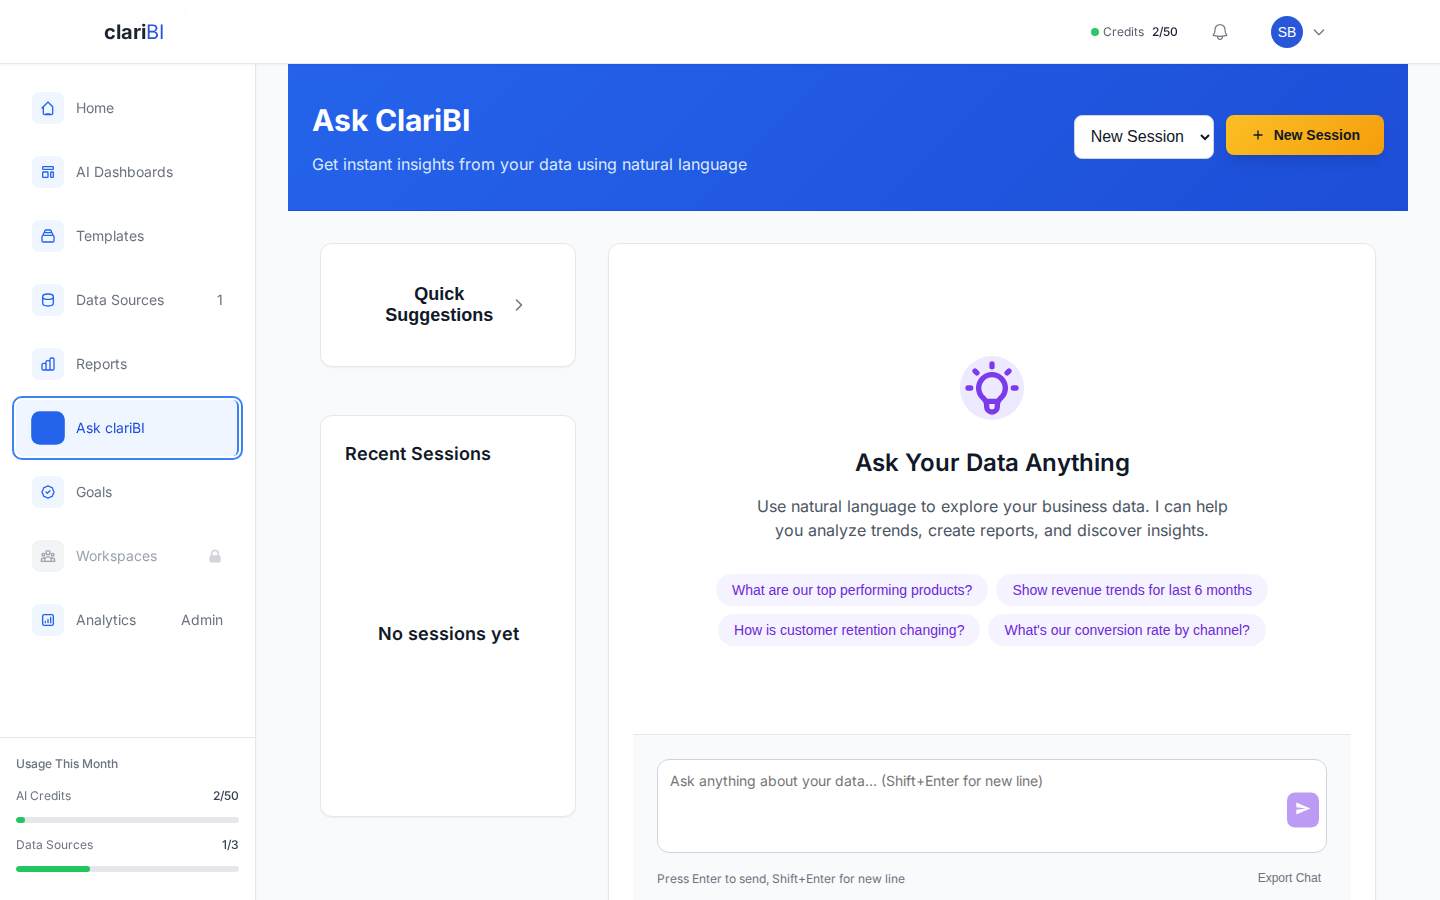
The Chat Interface
Navigate to Analytics (or Conversational Analytics) in the sidebar. You will see a chat-style interface with a text input at the bottom.
Asking Your First Question
Type a question in plain English and press Enter (or click Send). The AI analyzes your connected data and returns a response within 5-30 seconds, depending on data volume.
Example Questions
What were our top 5 products by revenue last quarter?

Show me monthly customer acquisition for the past 12 months.

What is the average order value by region?

Compare marketing spend vs. revenue for each channel.

Which support categories have the longest resolution times?
Understanding Responses
A typical AI response includes:
Written Analysis
A text explanation of the findings, usually 1-3 paragraphs. This provides context and interpretation of the data.
Chart
An auto-generated visualization chosen by the AI based on data characteristics. Common formats include bar charts for comparisons, line charts for trends, KPI dashboards for key metrics, data tables, and structured insight cards.
Data Table
The raw data behind the analysis, shown as a sortable table. Useful for verifying exact numbers.
Follow-Up Questions
The conversation maintains context. You can ask follow-up questions that reference previous answers:
You: What were our top 5 products by revenue last quarter?
AI: [Shows bar chart and analysis]

You: Break that down by month.
AI: [Shows monthly trend for those 5 products]

You: Which one grew the fastest?
AI: [Identifies the fastest-growing product with growth rate]
Context is maintained within a conversation session. Starting a new conversation resets the context.
Selecting Data Sources
By default, the AI analyzes all your connected data sources. To focus on specific sources, click New Session and use the data source picker in the session creation dialog. You can select one or multiple sources, or leave the selection empty to analyze all available sources.
Conversation History
Previous conversations are saved and accessible from the left panel. You can revisit past analyses, continue a previous conversation, or start fresh.
Exporting Conversations
To save your conversation for later reference, click the Export Chat link below the input area. This downloads the full conversation as a Markdown file including all questions and AI responses.
Advanced Usage
Specifying Time Ranges
Be explicit about dates for more accurate results:
Show me revenue for January 2025 through March 2025.
Compare Q4 2024 vs Q4 2023.
What happened in the last 30 days?
Requesting Specific Chart Types
You can tell the AI what kind of visualization you want:
Show me a pie chart of revenue by category.
Create a line chart of daily active users for the past month.
I want a scatter plot of price vs. quantity sold.
Asking for Comparisons
Compare this quarter to last quarter.
How does the East region compare to West?
Which marketing channel has the best ROI?
Requesting Calculations
What is the average order value by customer segment?
Calculate the month-over-month growth rate.
What percentage of total revenue comes from our top 10 customers?
Tips for Better Results
- Be specific: "revenue by product for Q4" beats "show me revenue"
- Name your columns: if you know the column names in your data, use them
- One question at a time: multi-part questions sometimes get partial answers
- Verify results: always sanity-check AI outputs against known values
For a complete guide on query techniques, see Writing Better AI Queries.
Credit Usage
Each question consumes credits based on the complexity of the analysis. The number of credits per query varies depending on data volume and the depth of the AI response. You can see credits consumed for each response in the message metadata below the AI reply. Follow-up questions within the same conversation tend to use fewer credits since context is already loaded.
Pro Tip
Start with broad questions to understand your data landscape, then use follow-ups to drill into specific areas. This approach is more credit-efficient than asking many independent detailed questions.
Related
Ready to try clariBI?
Start your free 14-day trial. No credit card required.