378 report and dashboard templates to start from
A template describes a set of metrics and charts for a common question, such as "marketing channel performance" or "support backlog". clariBI matches it to the columns in your connected data and generates the report or dashboard.
Available in the trial and on Starter, Professional and Enterprise. Generating from a template uses AI credits.
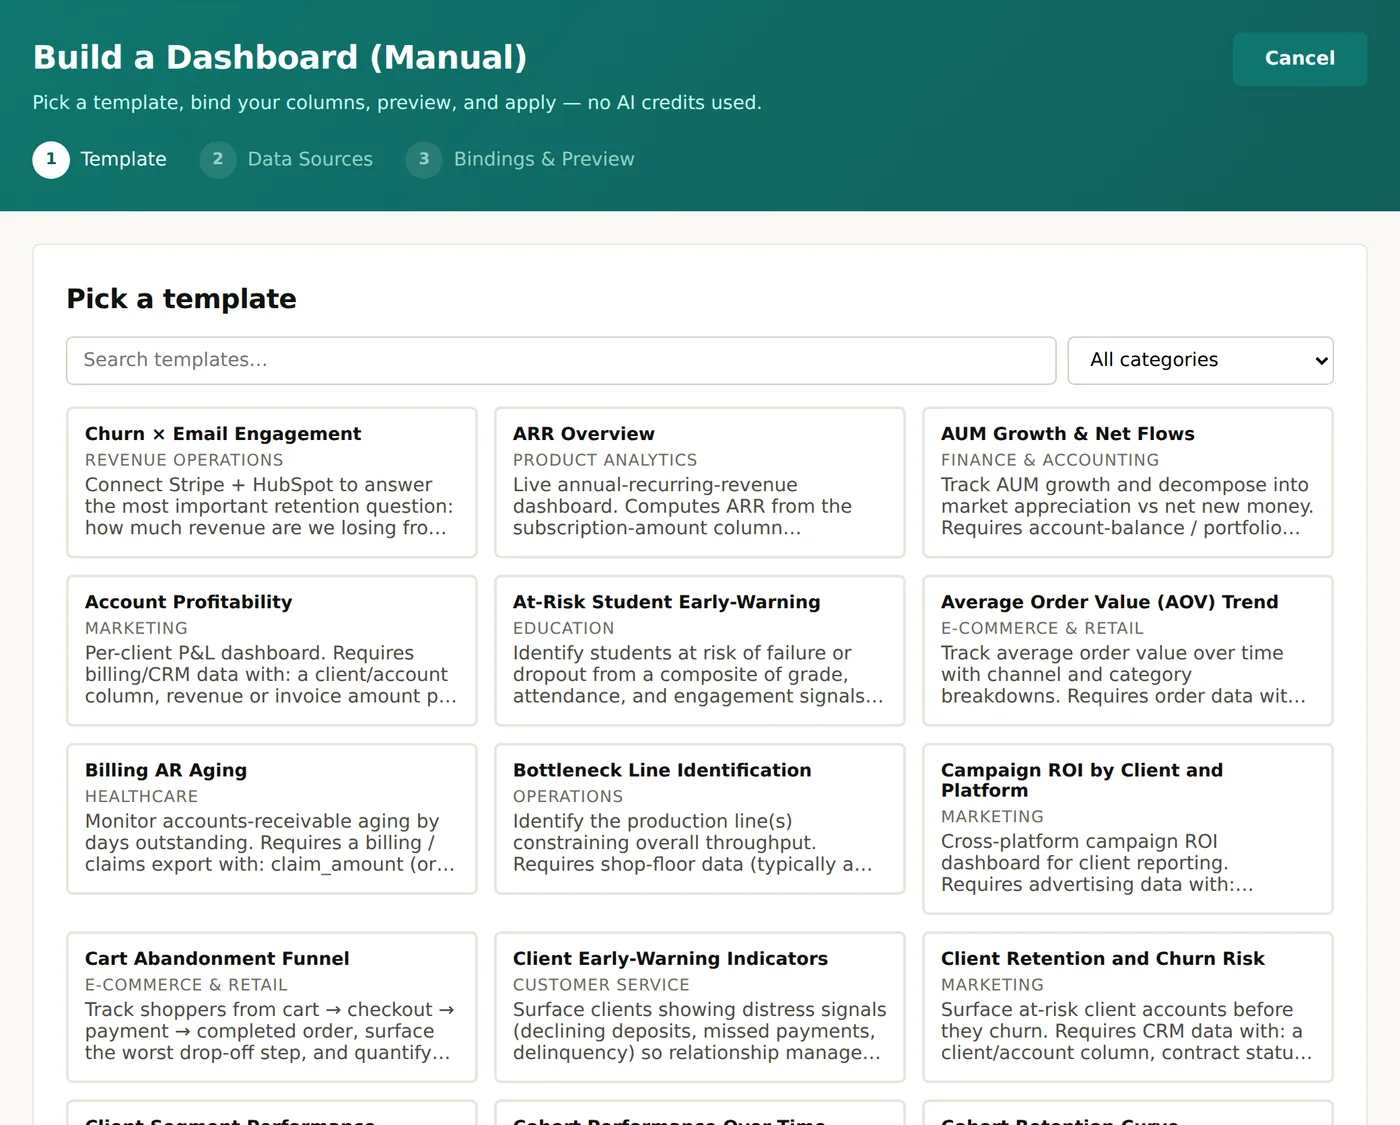
320 reports and 58 dashboards in 27 categories
Template counts by category change as templates are added. The largest groups are marketing, operations and product analytics.
| Category | Examples of what the templates cover |
|---|---|
| Marketing, sales and CRM | Channel and campaign performance, lead sources, pipeline, sales activity, forecast accuracy |
| Finance and accounting | Revenue, costs, cash, receivables aging, margins |
| E-commerce and retail | Orders, average order value, product mix, repeat purchase |
| Product and digital analytics | Signups, activation, retention, funnels |
| Operations, customer service, HR | Throughput, backlog, response times, headcount |
| Industry sets | Healthcare, education, manufacturing, logistics, food and beverage, real estate, legal and professional services, nonprofit, government, media and more |
From template to your own dashboard
Pick
Browse by category or search. Each template lists the kind of data it needs and, where it helps, which integrations usually hold it.
Match
Each metric in the template has hints about the columns it needs. clariBI matches them to your sources. If nothing fits, the metric is shown as empty rather than filled with a guess.
Generate
The report or dashboard is generated from your data, with numbers in the text checked against the charts. You can edit the result like any other.
Reuse what works
- Save a dashboard or report you built as a template for your organization.
- A template does not contain data. It only describes metrics and layout, so it can be applied to another source.
Try it on your own data
The trial lasts 14 days and needs no credit card. When it ends you move to the Free plan and keep your data and source dashboards.