AI That Sees Across All Your Data
Your Stripe data alone can't tell you which marketing channels bring the best customers. Our AI connects the dots across all your tools to surface insights no single source can reveal.
The Dashboard Building Nightmare
Hours of Manual Work
Building a single dashboard takes 8-20 hours of selecting charts, configuring filters, and arranging layouts. Most small teams simply don't have the time.
Guessing What Matters
Without data expertise, you're left guessing which metrics to track, what visualizations work best, and how to spot important trends.
Static, Outdated Dashboards
Even after spending hours building dashboards, they become obsolete quickly. Business needs change, but updating dashboards is another manual nightmare.
The Traditional Way
Planning what to track, researching best practices, arguing about which metrics matter
Building charts, configuring data sources, debugging connection issues
Design tweaks, layout adjustments, stakeholder feedback cycles
Constant maintenance, updates, and fixes as requirements change
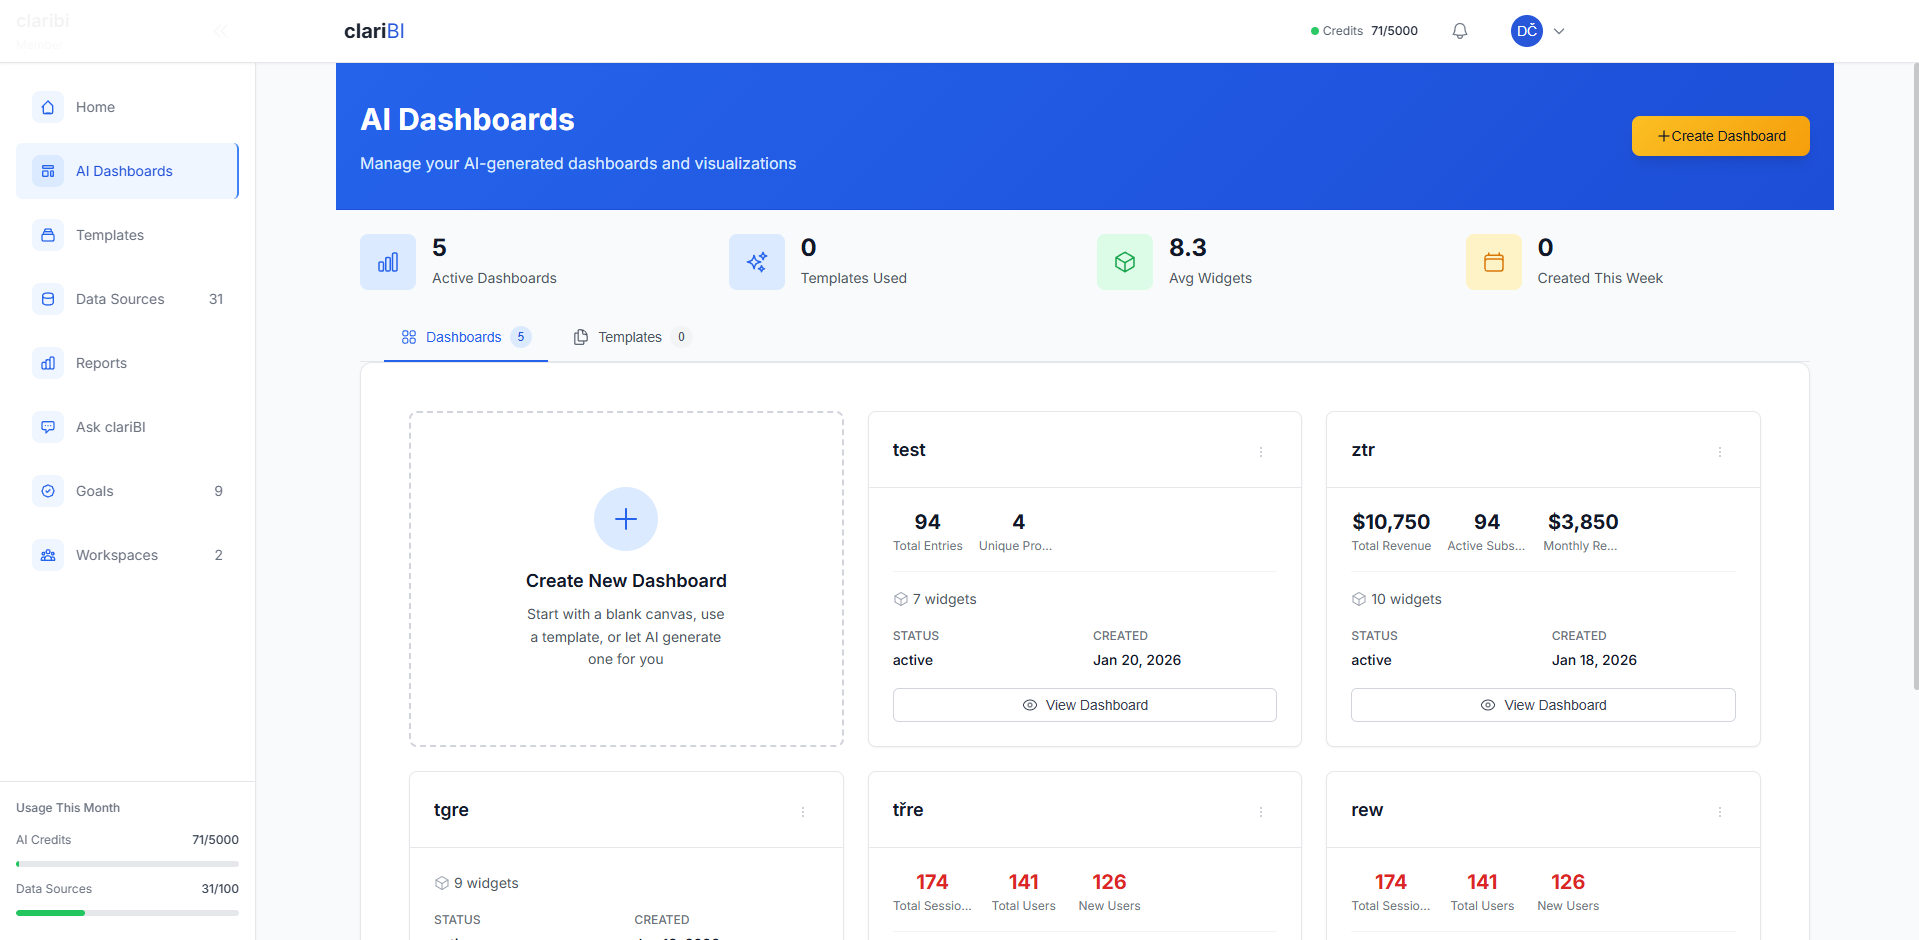
How AI Transforms Dashboard Creation
Get dashboards in minutes instead of months. Connect your data, pick a template, and let AI generate dashboards tailored to your industry and metrics.
AI Analyzes Your Data
Connects to your business tools and automatically identifies patterns, trends, and key performance indicators specific to your industry.
Identifies key metrics
Business context aware
Creates Optimal Layouts
Automatically selects the best visualization types, arranges them logically, and applies data visualization best practices.
Beautiful layouts
Mobile optimized
Adds Intelligent Insights
Includes AI-powered insights, trend explanations, and actionable recommendations that help you understand what the data means.
Action recommendations
Trend explanations
Time to Value Comparison
Traditional BI Tools
clariBI AI
What Makes Our AI Different
Advanced AI capabilities designed specifically for business intelligence
Automatic Visualization Selection
Our AI doesn't just dump data into random charts. It understands data types, relationships, and business context to choose the most effective visualization for each insight.
Business Context Understanding
Unlike generic BI tools, our AI understands different business models and automatically applies industry-specific metrics and benchmarks to your dashboards.
Intelligent Anomaly Detection
AI continuously monitors your data for unusual patterns, unexpected changes, and emerging opportunities that you might miss in static reports.
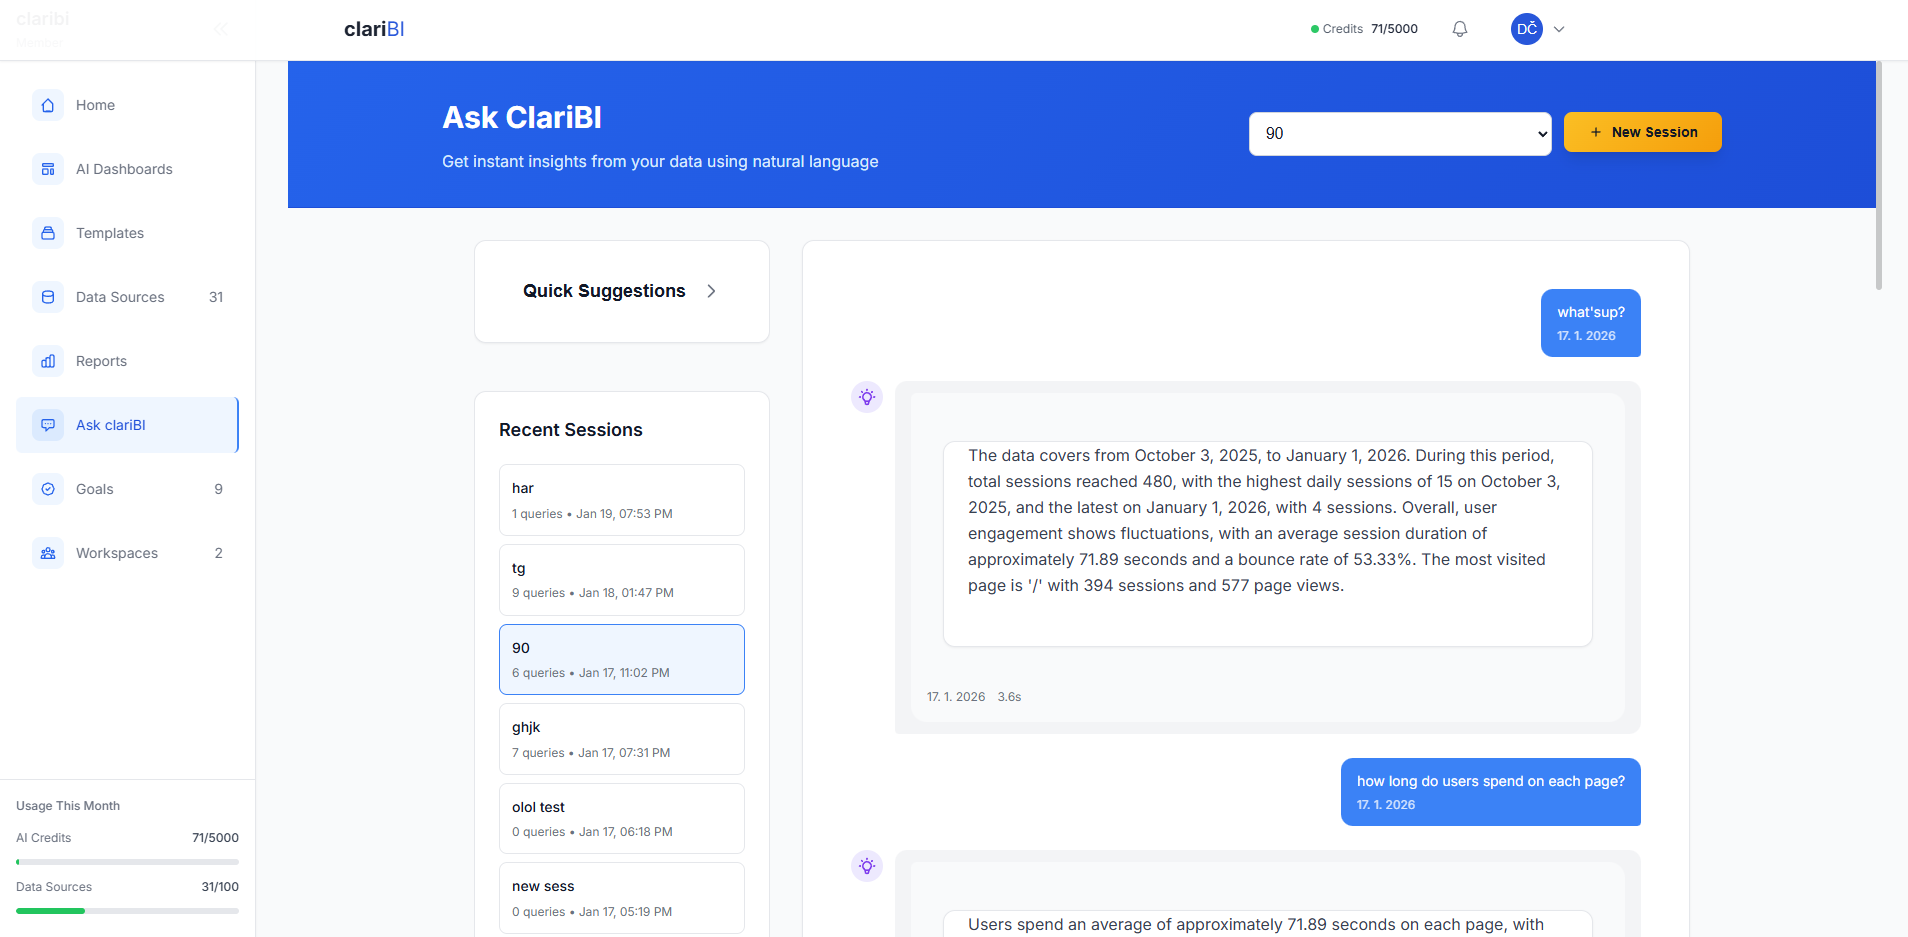
AI-Powered Analysis
clariBI's advanced AI engine analyzes your data and provides intelligent insights based on the patterns and trends in your business information.
What AI-Powered Analytics Can Discover
See examples of dashboards automatically generated by AI
SaaS Analytics Dashboard
Automatically generated from subscription data
AI Insights Discovered:
- • Customer onboarding completion patterns
- • Feature adoption correlation with retention
- • Revenue growth trend analysis
- • Churn risk indicators
Dashboard automatically updates daily with new data patterns and insights.
Ecommerce Analytics Dashboard
Automatically generated from sales data
AI Insights Discovered:
- • Customer acquisition channel performance
- • Product recommendation opportunities
- • Seasonal sales patterns
- • Cart abandonment triggers
Early access platform (dashboards generated from your connected data sources).
Why Choose AI-Powered Analytics
The difference is clear when you compare the results
Minutes, Not Months
Get your first dashboard in minutes. No technical setup, no waiting for IT resources.
Actionable Recommendations
AI identifies patterns across your data and surfaces recommendations you can act on.
Lower Total Cost
No expensive data analysts, no complex tool licenses, no maintenance overhead.
Let AI Build Your Perfect Dashboard Today
Stop wasting time on manual dashboard building. See what AI can create for your business in the next 5 minutes.
Free 14-day trial • Dashboard ready in minutes • No technical setup