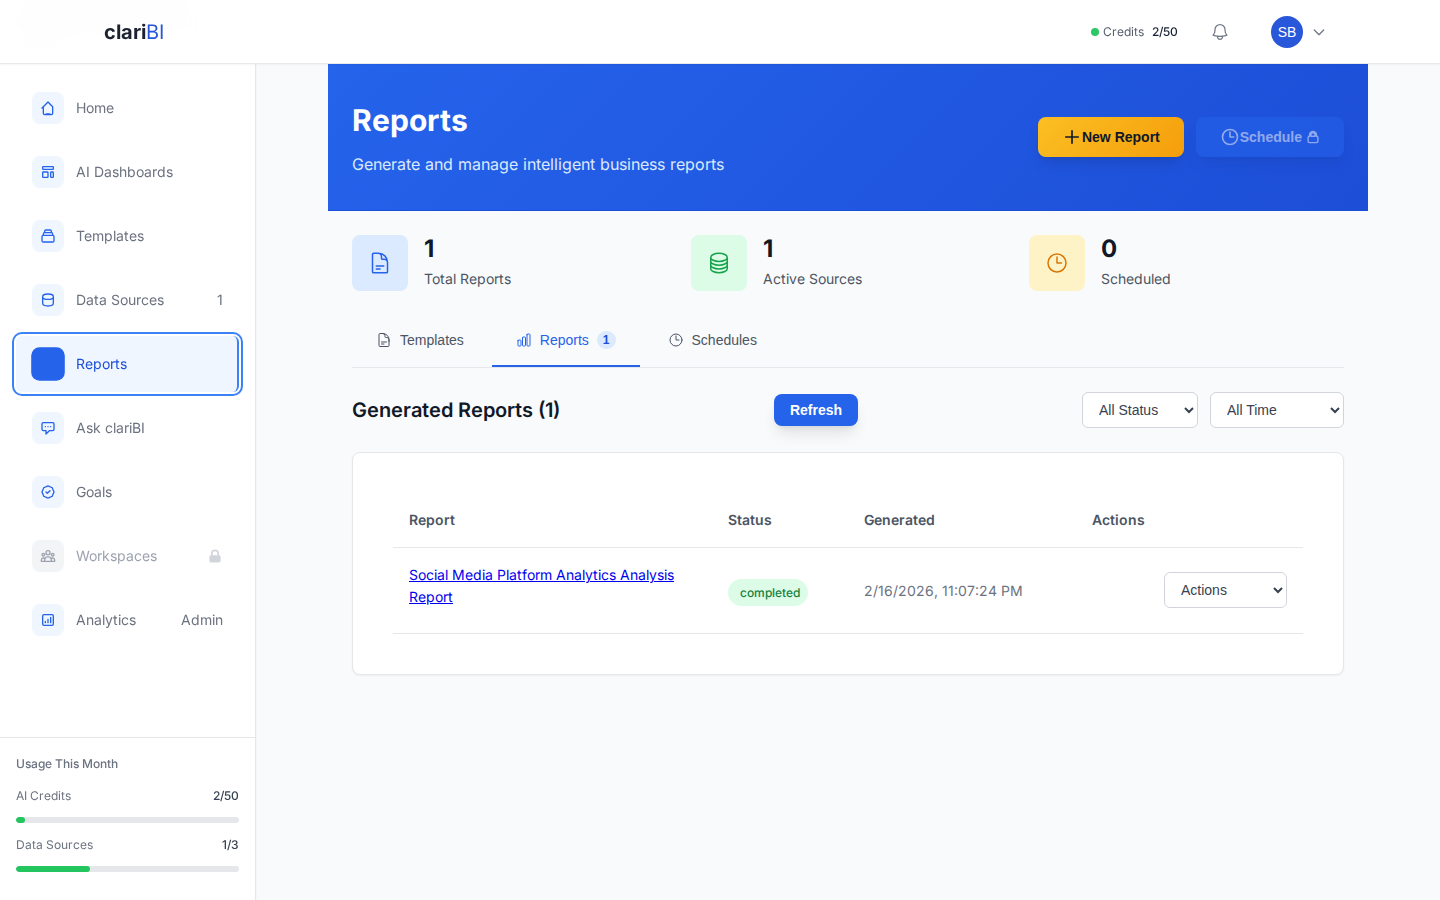
Generating Reports
Estimated reading time: 15 minutes
This guide covers every option for generating reports in clariBI, from basic template-driven reports to advanced multi-source custom analyses.
Prerequisites
- At least one connected data source with synced data
- Available AI credits
- Member role or higher
Method 1: Generate From a Template
Templates are the fastest and most reliable way to create reports. Each template defines the analysis structure, metrics, and output format.
Go to Reports and click Generate Report. Click the Templates tab and browse by category or search by keyword. Categories include Sales & CRM, Marketing, Finance & Accounting, Operations, Customer Service, HR & People, Product Analytics, E-commerce & Retail, and more (28 categories total).
Click a template to open the report generator. In Step 1 (Select Data), choose one or more connected data sources. The generator shows recommended sources for the template and highlights any missing requirements.
In Step 2 (Configure), set your report title, choose an analysis type (Full, Summary, or Quick Insights), and toggle which sections to include: AI-Generated Insights, Actionable Recommendations, and Key Performance Metrics.
Click Generate Report. The AI processes your data with real-time progress updates. You can also click Run in Background to continue working - you will be notified when the report is ready.
Method 2: Custom Prompt
For ad-hoc analysis that does not match any template, describe what you want in plain English:
- Go to Reports > Generate Report
- Click the Custom tab
- Write a description of the analysis you want. Be specific about what data to examine, what questions to answer, and what format you prefer.
- Select your data source(s)
- Click Generate
Example custom prompts:
Analyze our sales data from the last 6 months. Break down
revenue by product category and region. Identify the top 3
growth areas and any categories showing decline. Include
month-over-month trend charts.
Compare customer support ticket volume and resolution times
between Q3 and Q4 2024. Highlight any categories where
resolution time increased. Suggest staffing adjustments.Understanding Report Output
A generated report is structured into sections:
Executive Summary
A 2-3 paragraph overview aimed at someone who will only read this section. Captures the most important findings and conclusions.
Key Metrics
Headline numbers shown as cards with change indicators (up/down arrows and percentages). These represent the most important quantitative findings.
Analysis Sections
Multiple sections, each focused on a specific aspect of the data. Each section includes charts, tables, and written analysis. The AI chooses chart types based on data characteristics (line for trends, bar for comparisons, pie for composition).
Key Findings
A numbered list of specific insights. These are the "so what" from the data - patterns, anomalies, and significant changes.
Recommendations
Suggested actions based on the findings. Keep in mind these are AI-generated suggestions that should be evaluated by someone with business context.
Multi-Source Reports
You can select multiple data sources for a single report. The AI will attempt to correlate data across sources. This works best when sources share common dimensions (dates, customer IDs, product names).
Limitations of Multi-Source
Cross-source analysis relies on the AI finding common fields to join on. If your sources have no overlapping columns, the report will analyze each source separately rather than correlating them. For best results, ensure sources share at least one common identifier.
AI Credit Usage
Report generation consumes AI credits based on:
- Data volume: more rows of data require more processing and use more credits
- Analysis complexity: more detailed analyses with multiple metrics consume more credits than simple summaries
- Number of data sources: multi-source reports that correlate data across sources use more credits
A typical single-source report uses 2-10 credits. Complex multi-source analyses can use 10-30 credits. Check your balance in Settings > Billing.
Report Actions
After generation, you can:
- Share - share with team members or generate a public link (Professional+)
- Share to Workspace - add the report to a workspace for team access
- Download - download as PDF (Professional+)
- Schedule - set up recurring generation (Professional+)
Pro Tip
Save reports you like as favorites. When you need to regenerate them with fresh data, you can re-run from the favorites list without reconfiguring everything. Also, review AI Limitations to understand what the AI can and cannot reliably do.
Related
Ready to try clariBI?
Start your free 14-day trial. No credit card required.