Interface Tour
Estimated reading time: 12 minutes
Where is everything in clariBI? This tour walks through every major section of the interface so you know exactly where to find what you need.
The Sidebar Navigation
The left sidebar is your primary navigation. It stays visible on desktop screens (1024px and wider) and collapses into a hamburger menu on tablets and phones. Here is what each item leads to:

| Menu Item | What It Does | URL |
|---|---|---|
| Home | Welcome greeting, key metrics, recent activity, and quick actions | /app/home |
| AI Dashboards | View, create, and edit dashboards | /app/dashboards |
| Templates | Browse 600+ analysis templates | /app/templates |
| Data Sources | Manage database, file, and API connections | /app/data-sources |
| Reports | Generate, schedule, and export reports | /app/reports |
| Ask clariBI | Conversational AI analytics interface | /app/conversational-analytics |
| Goals | Set and track business goals with milestones | /app/goals |
| Workspaces | Collaborative team spaces for sharing work (Professional+) | /app/collaboration |
Note
Workspaces shows a lock icon on Free, Trial, and Starter plans. Team collaboration features require a Professional or Enterprise subscription. Settings is accessed from the user menu (your avatar in the top-right corner), not from the sidebar.
Home Page
The Home page is your landing page after login. It includes:
- Welcome Greeting - a personalized greeting with action buttons to start a new analysis or create a report.
- Key Metrics - four stats at a glance: Total Reports, Active Data Sources, AI Dashboards, and AI Insights.
- Recent Activity - a feed of recent actions from you and your team.
- Quick Actions - four shortcut cards: Connect Data Source, Create Dashboard, Browse Templates, and Ask AI.
- Recent Analyses - a combined list of your recent reports, dashboards, and conversation sessions.
- AI Insights - a rotating display of AI-generated insights from your data, with a link to view all insights.
Dashboards Page
The Dashboards page lists all dashboards you have access to. You can:
- Create a new dashboard from scratch or from a template
- Open the visual dashboard builder to add and arrange widgets on a grid layout
- Share dashboards with teammates or generate a public link (Professional+)
- Set dashboards to auto-refresh on a schedule
See Dashboards Overview for full details.

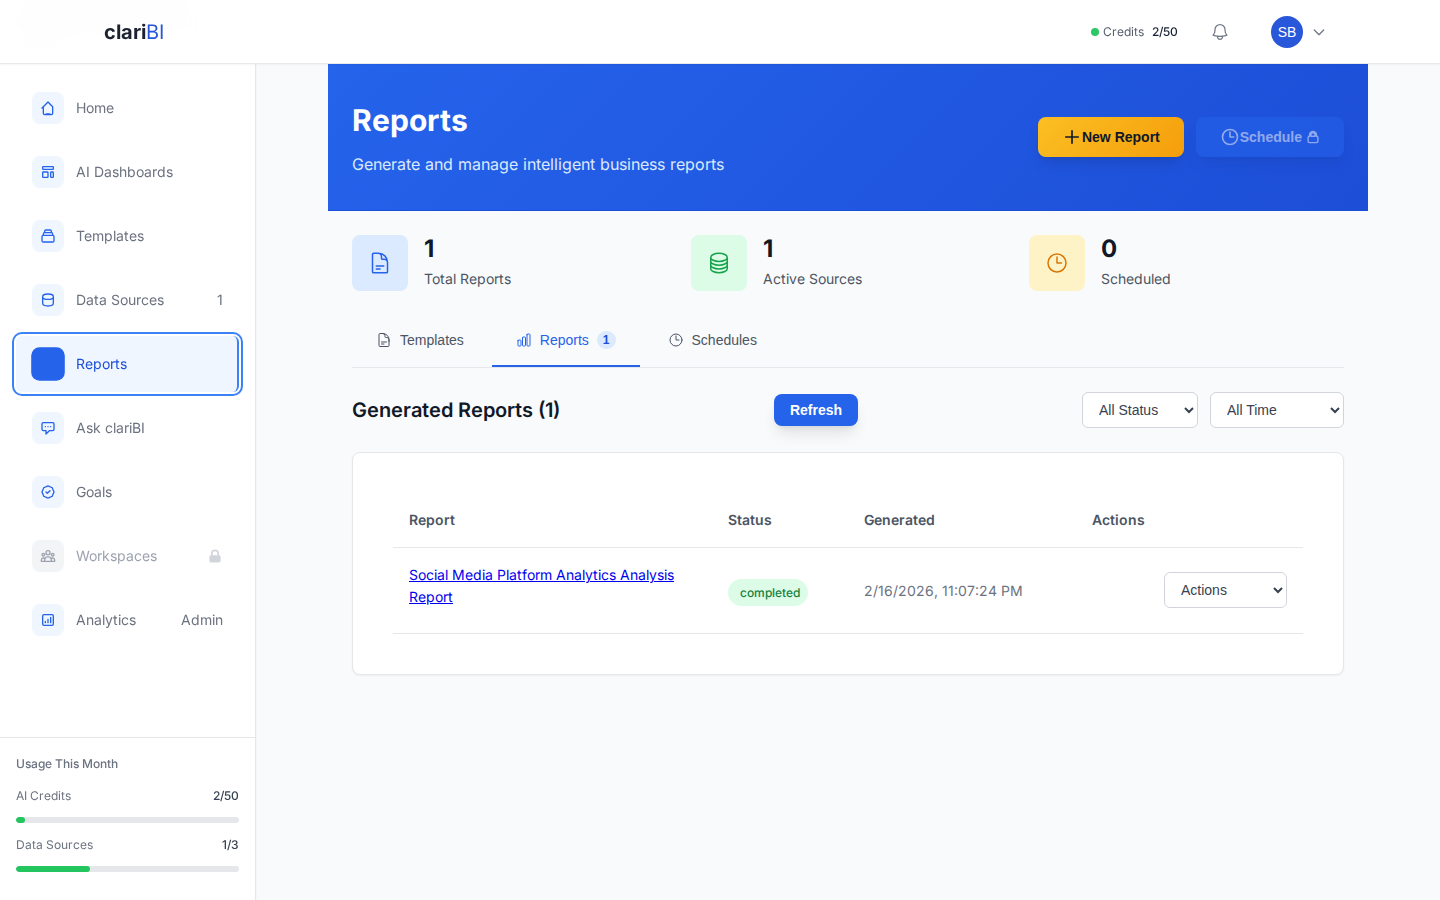
Reports Page
The Reports page shows all generated reports. Reports are AI-produced documents with executive summaries, key findings, charts, and recommendations. You can:
- Generate a new report by selecting a template and data source
- Schedule recurring reports (Professional+)
- Export to PDF, Excel, or CSV (Professional+)
- Share reports internally or via public link
See Reports Overview for more.
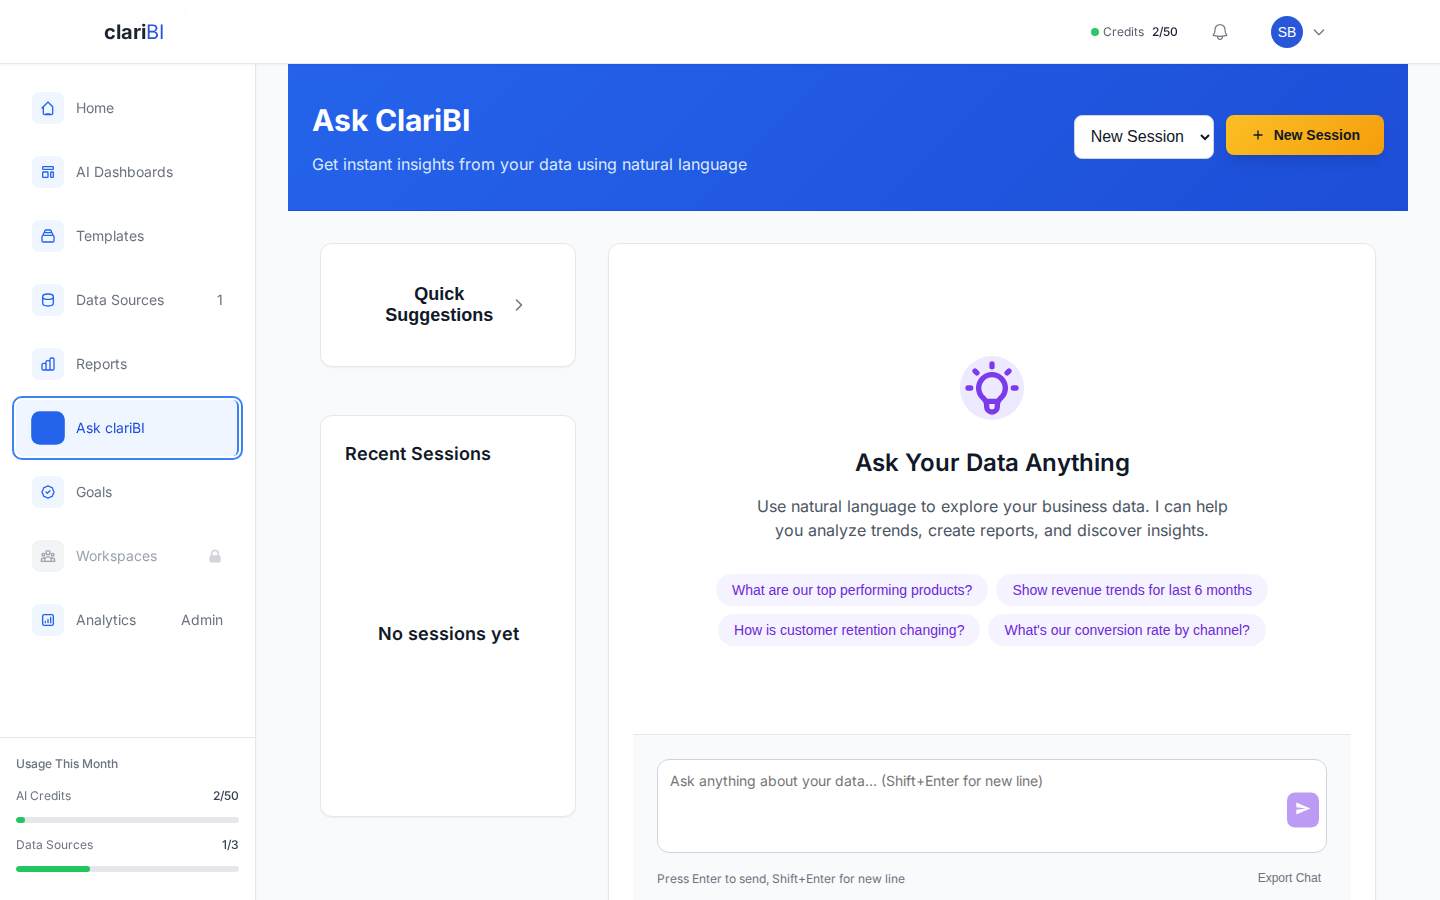
Conversational Analytics
This is the AI-powered question-and-answer interface. Type a natural language question and clariBI analyzes your connected data using AI. Results come back as text explanations, data tables, and auto-generated charts.
You can ask follow-up questions in the same conversation to drill deeper. See Conversational Analytics for query tips.
Data Sources Page
This page lists all your connected data sources with their sync status, last sync time, and connection health. You can add new sources, test connections, and trigger manual syncs. A Monitoring tab shows connection health charts, data quality metrics, and sync performance.
clariBI supports databases (PostgreSQL, MySQL, SQLite, MongoDB), file uploads (CSV, Excel, JSON, PDF), Google Analytics, Google Sheets, Jira, Confluence, Meta Ads, and REST APIs. See Data Sources Overview.
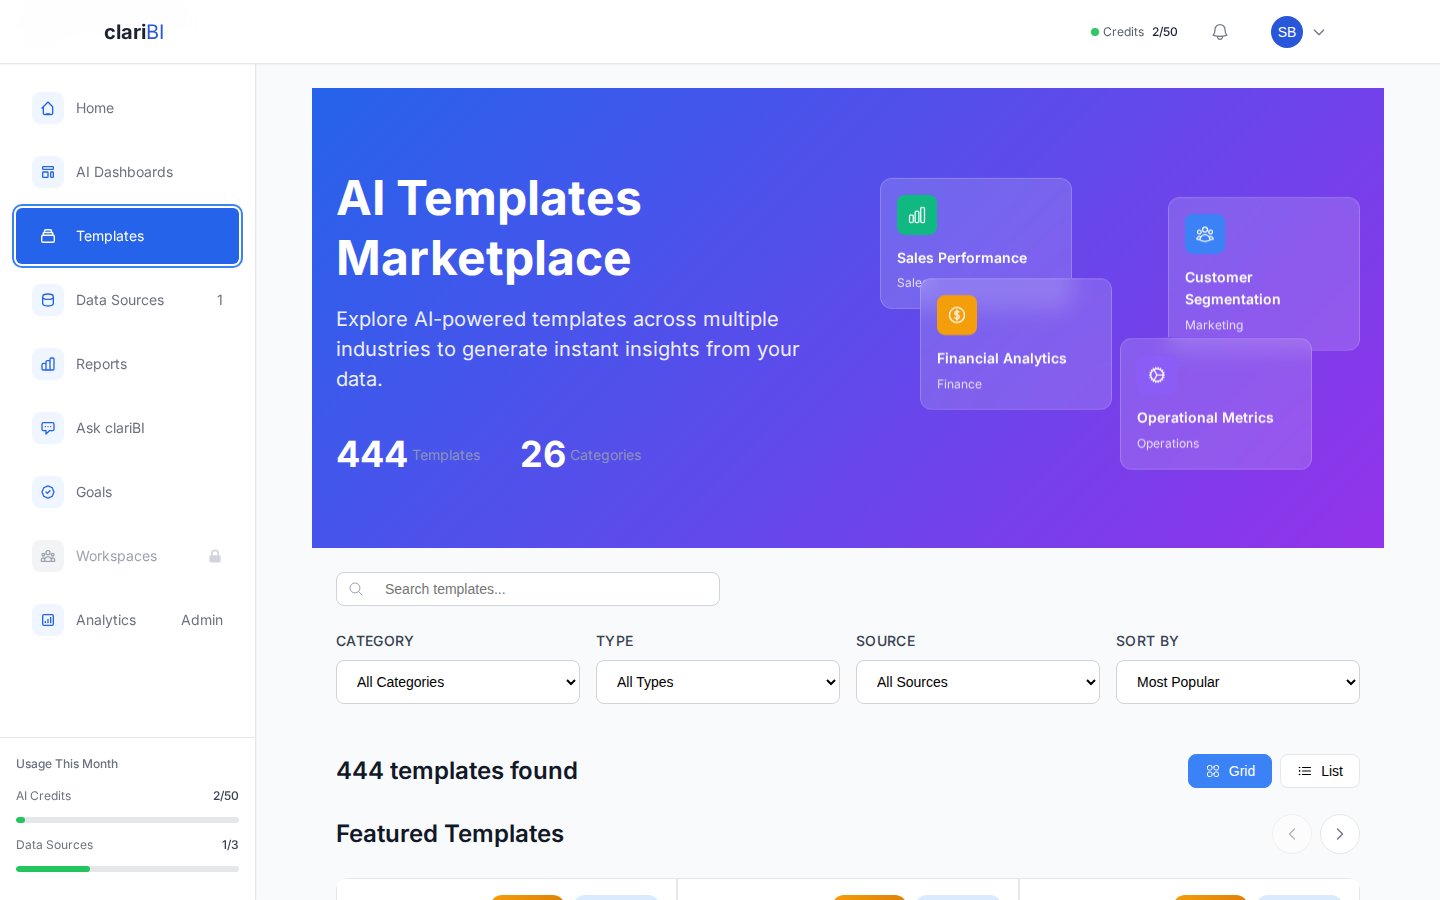
Templates Marketplace
Browse 600+ pre-built analysis templates organized by category (Sales, Marketing, Finance, Operations, HR, and more). Each template defines the metrics, charts, and analysis structure. Pick one, connect your data, and get a ready-made dashboard or report in seconds.
See Template Marketplace for the full catalog.
Goals Page
Set measurable business goals with target values and deadlines. Add milestones to break goals into stages. Link goals to live data sources so progress updates automatically.
See Goals Overview.
Workspaces
Workspaces are shared spaces where teams can organize related dashboards, reports, and discussions. Every organization gets a default workspace. You can create additional workspaces for departments or projects.
See Workspaces.
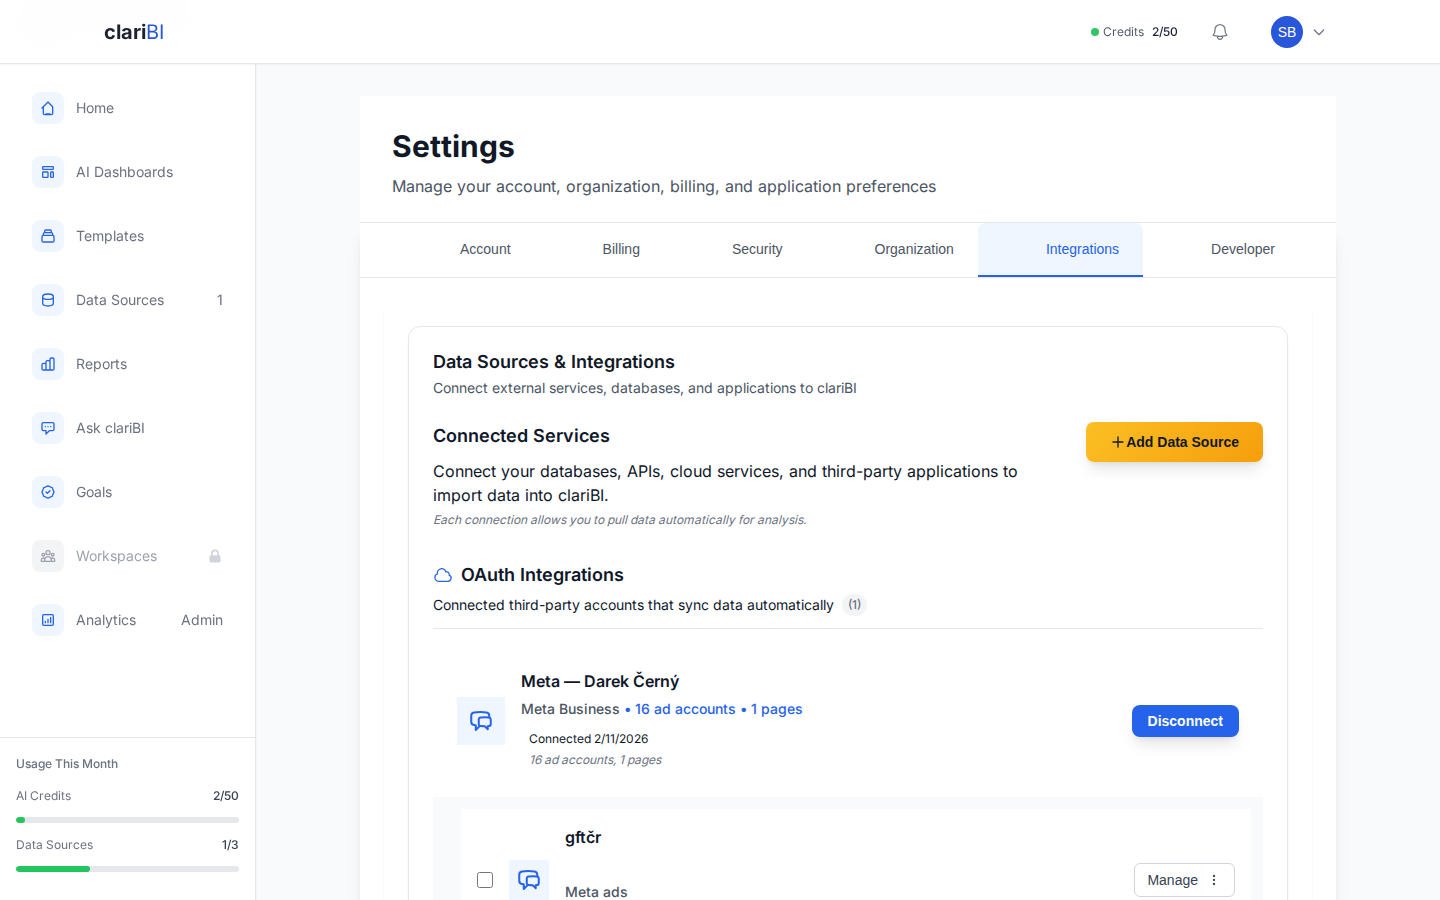
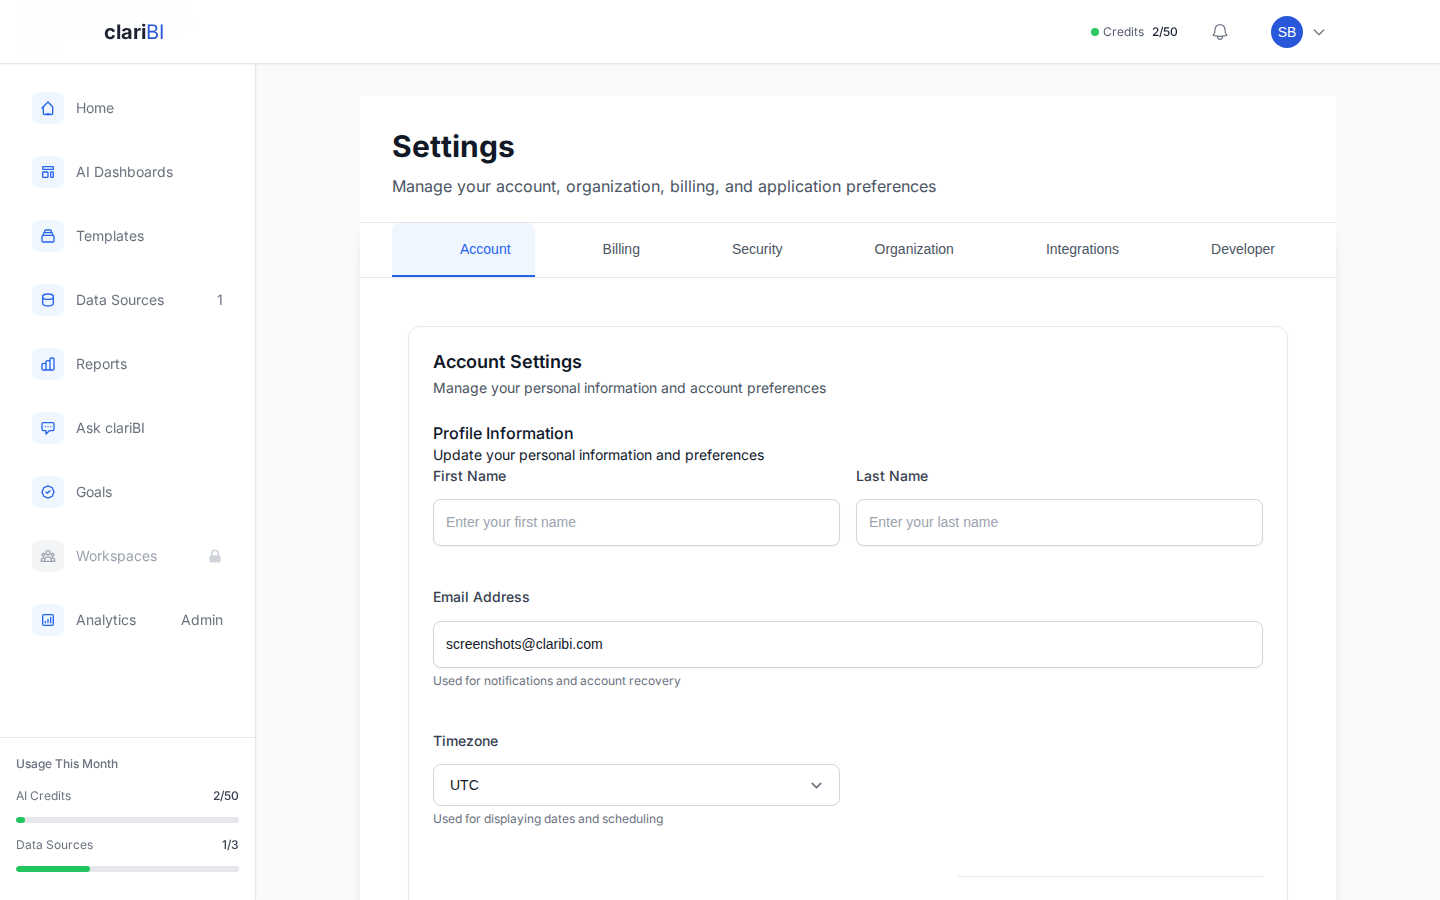
Settings
The Settings page has multiple tabs:
- Account - profile info, password, notification preferences
- Security - MFA setup, session management, API keys
- Organization - company details, team members, role management
- Billing - current plan, usage, invoices, upgrade options
- Integrations - connected third-party services
The tabs you see depend on your role. Owners and Administrators see all tabs. Members and Viewers see only Account and Security.
Mobile Layout
On screens narrower than 640px, the sidebar collapses into a hamburger menu at the top. All pages reflow to a single-column layout. Dashboard widgets stack vertically. Charts resize to fit the screen width.
Pro Tip
The mobile layout is read-optimized. For building dashboards and configuring data sources, a desktop or tablet screen works better because of the form-based widget configuration and grid layout.
Notifications
The bell icon in the top-right corner shows real-time notifications. These include data source sync completions, report generation status, team invitations, and workspace activity. Notifications are delivered in real time so you never miss an update.
Next Steps
Ready to try clariBI?
Start for free or begin a 14-day trial with full AI-powered analytics. No credit card required.