Generate Your First Report
Estimated reading time: 8 minutes
Reports in clariBI are AI-generated documents that analyze your data and produce executive summaries, key findings, charts, and recommendations. Here is how to create your first one.
Prerequisites
- At least one connected and synced data source
- Available AI credits (check usage in Settings > Billing)
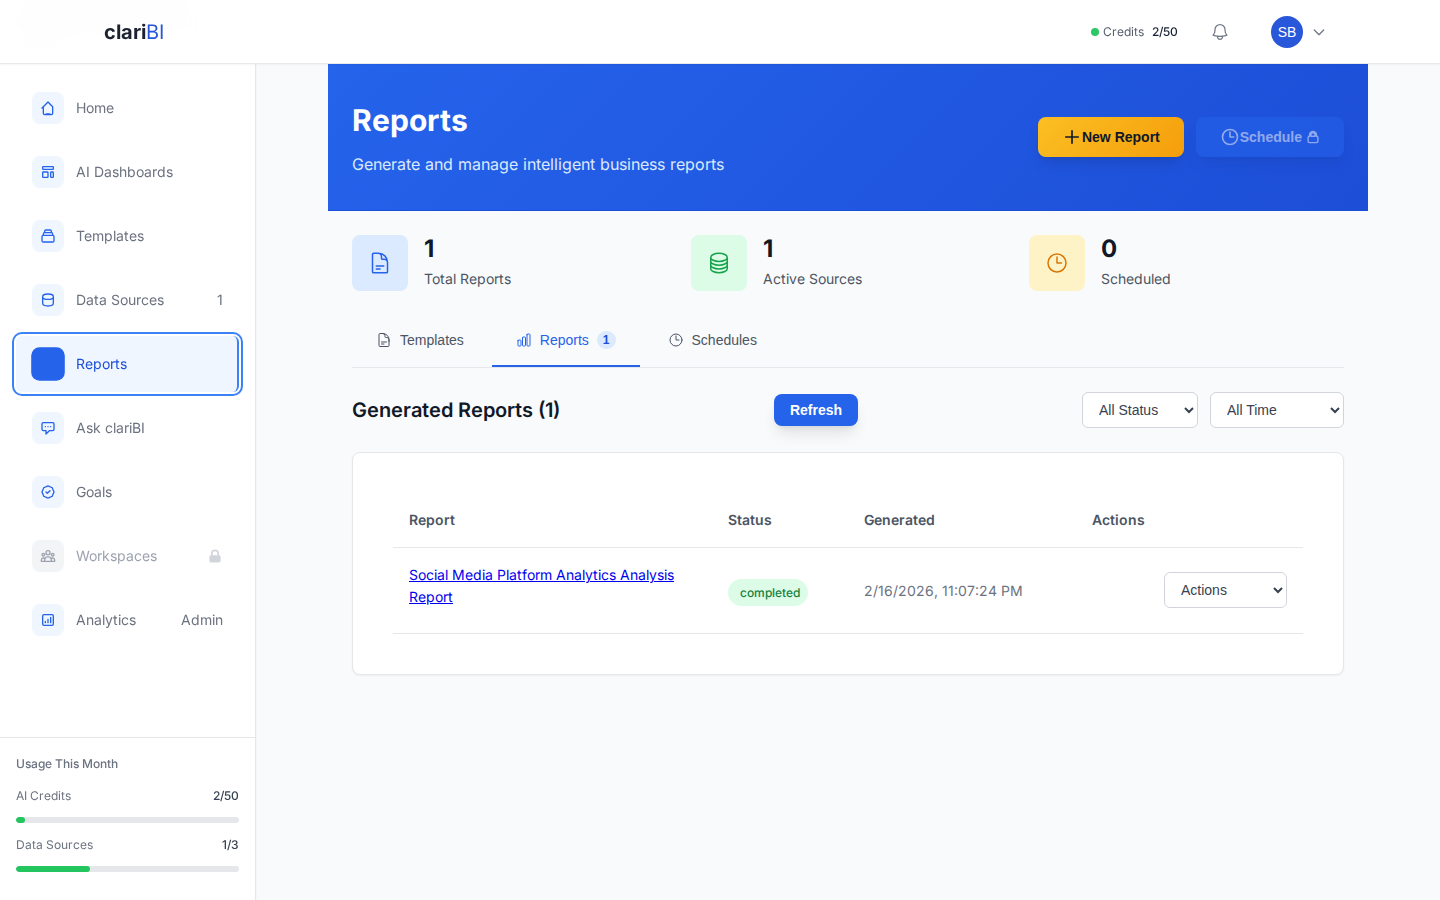
Step 1: Navigate to Reports
Click Reports in the sidebar. If you have not generated any reports yet, you will see an empty state with a prompt to create your first one.
Step 2: Choose a Template
Click New Report in the page header, or browse the Templates tab to find one of 600+ pre-built templates (e.g., "Monthly Sales Summary", "Customer Churn Analysis", "Marketing ROI Report"). Click Generate Report on any template card to begin. Templates define the analysis structure, metrics, and chart types, so they are the fastest way to get insights.
Step 3: Select a Data Source
The report generator walks you through three steps: Select Data, Configure, and Generate. In the first step, pick which data source to analyze. You can select one or multiple connected sources. The generator shows required and recommended data sources for your chosen template.
Step 4: Configure and Generate
In the Configure step, set your report title, choose an analysis type (Full, Summary, or Quick Insights), and select which sections to include (AI-Generated Insights, Actionable Recommendations, Key Performance Metrics). Then click Generate Report. Processing typically takes 10-30 seconds depending on data volume. You will see a progress indicator, and you can click Run in Background to continue working while the report generates.
Step 5: Review Your Report
A generated report typically contains:
- Executive Summary - a high-level overview of the findings in 2-3 paragraphs
- Key Metrics - the most important numbers, with change indicators
- Detailed Analysis - charts and tables with commentary
- Key Findings - numbered insights the AI extracted from your data
- Recommendations - suggested actions based on the analysis
Pro Tip
AI-generated reports are a starting point, not the final word. Always review the findings against your business context. The AI may miss nuances that require domain knowledge. See AI Limitations for what to watch for.
What Uses AI Credits?
Each report generation costs AI credits based on the amount of data processed and the analysis complexity. Costs vary by report -- simpler analyses use fewer credits than multi-source deep dives. Your credit balance is visible in Settings > Billing.
Next Steps
- Report Generation In-Depth for advanced options
- Schedule Recurring Reports (Professional+)
- Export Reports to PDF, Excel, or CSV
- Browse Report Templates
Ready to try clariBI?
Start for free or begin a 14-day trial with full AI-powered analytics. No credit card required.