Get Everyone on the Same Data Page
No more screenshots. No more "which spreadsheet are you looking at?" Share dashboards that pull from all your connected sources. Comment on insights. Schedule reports. Keep everyone aligned on the same up-to-date data.
Data Silos Kill Team Performance
Email Screenshot Hell
Sending charts via email, arguing over which numbers are correct, and working with different versions of the same report creates chaos and delays.
Everyone's Looking at Different Data
Marketing has Google Analytics, sales has CRM reports, and executives have their own Excel dashboards. Nobody's seeing the full picture.
Endless "Data Meetings"
Spending hours in meetings just to align on what the numbers actually mean, instead of discussing what actions to take based on insights.
Lost Context & Insights
When someone discovers an important trend or insight, it gets lost in Slack or buried in email. The rest of the team never benefits from those discoveries.
What Your Team Can Do Together
"Here's the dashboard. Everyone's looking at the same numbers now"
Share dashboards and reports in team workspaces
"I noticed something in the data. Adding a comment so the team sees it"
Leave comments directly on charts and insights
"The Monday report goes out automatically to everyone who needs it"
Schedule reports to keep the whole team informed
"Sales can see their metrics, marketing sees theirs. All in one place."
Organize resources by team with role-based access
Collaboration Features
Tools for your team to work together effectively with data
Comments & Discussions
Add comments to shared dashboards and reports. Discuss insights with your team and get AI-powered answers using @claribi mentions.
Key Features:
- • Comment on dashboards and reports
- • @mentions to notify team members
- • Threaded conversations with replies
- • @claribi for AI-powered insights
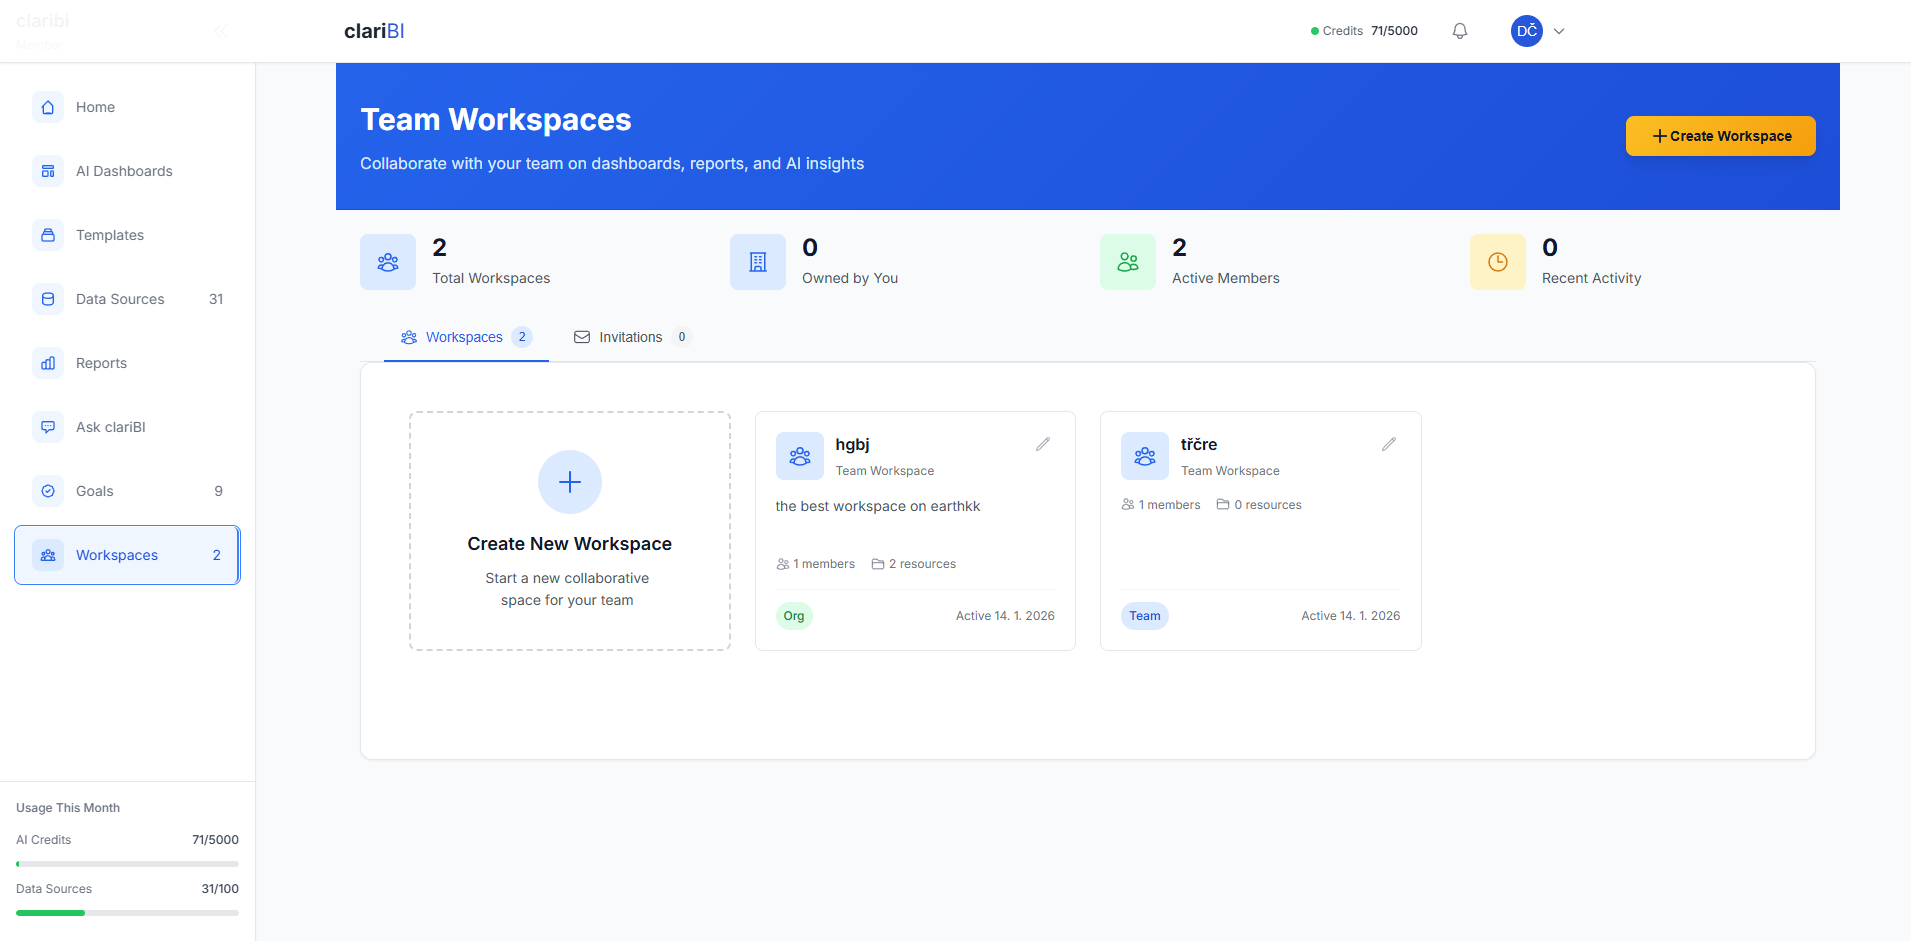
Shared Workspaces
Create team workspaces to organize shared dashboards, reports, and AI queries. Keep everyone on the same page with centralized data access.
Key Features:
- • Team and department workspaces
- • Share dashboards and reports
- • Activity feed for updates
- • Invite team members
Permissions & Sharing
Control access with role-based permissions. Share dashboards publicly with secure links for external stakeholders.
Key Features:
- • Role-based access control
- • Owner, editor, viewer roles
- • Public sharing links
- • Workspace member management
How Different Teams Collaborate
Real scenarios from companies using clariBI for team alignment
Marketing & Sales Alignment
TechStart SaaS Company
The Challenge
Marketing and sales teams were arguing about lead quality. Marketing claimed they were hitting MQL targets, but sales said the leads weren't converting.
The Solution
Created a shared workspace with end-to-end funnel visibility. Both teams can see lead sources, qualification metrics, and conversion rates with commenting enabled.
The Result
Teams now collaborate on lead scoring criteria through dashboard comments. Lead quality improved 45% and time-to-resolution for disputes dropped from days to minutes.
Executive Decision Making
Fast-Growing E-commerce Brand
The Challenge
Weekly executive meetings spent 60% of time aligning on what the numbers meant before discussing strategy. Different departments had conflicting reports.
The Solution
Built an executive dashboard with fresh data from all departments updated daily. Team members comment on trends throughout the week, so meetings start with strategy, not data clarification.
The Result
Meeting efficiency improved 70%. Decisions that used to take 2-3 meetings now happen in one. Revenue growth accelerated 30% due to faster strategic pivots.
Product Team Analytics
SaaS Product Company
The Challenge
Product managers, engineers, and designers were working with different user analytics tools, leading to conflicting priorities and feature debates.
The Solution
Created unified product analytics workspace where the team collaborates on user behavior analysis. Comments link directly to feature requests and development tasks.
The Result
Feature adoption rates improved 60% because decisions are based on shared user data insights. Development cycles shortened 25% due to better alignment.
Remote Team Coordination
Distributed Marketing Agency
The Challenge
Remote team across 6 time zones struggled to stay aligned on client campaign performance. Insights were lost between handoffs and time zone differences.
The Solution
Built shared client workspaces with commenting. Team members leave insights for the next shift, creating a continuous knowledge transfer system.
The Result
Client satisfaction scores increased 40% due to 24/7 monitoring and optimization. Team productivity improved 35% through better knowledge sharing.
Additional Features
More ways to collaborate with your team
Notifications
Get notified when team members mention you in comments or when there's activity in your workspaces.
Resolve Comments
Mark comments as resolved when discussions are complete. Keep your workspace organized and focused on active conversations.
AI in Comments
Use @claribi in any comment to ask questions about your data. Get AI-powered insights directly in your discussions.
Public Sharing
Generate public links to share dashboards and reports with external stakeholders. No account required to view.
Activity Feed
Track all workspace activity in one place. See when dashboards are shared, comments are added, and members join.
Team Management
Invite team members to workspaces with specific roles. Manage who can view, comment, or edit shared resources.
Get Your Team on the Same Page Today
Stop wasting time on data alignment meetings. Start collaborating with fresh data that everyone can trust, comment on, and act upon together.
Team workspaces included 14-day free trial No setup required
Team Collaboration FAQ
Common questions about working together in clariBI
How many team members can I add?
Team member limits vary by plan: Starter includes 3 users, Professional includes 15 users, and Enterprise includes up to 100 users. See our pricing page for details.
Can I control what different team members see?
Yes! Use role-based permissions to control access to specific dashboards, data sources, and features. You can use our preset roles: Owner, Administrator, Analyst, Member, and Viewer.
Do comments and discussions stay in sync?
Yes. Comments, reactions, and discussions are available for all team members viewing the dashboard. The page updates when you navigate to it.
Can I share dashboards with people outside my organization?
Yes! Create secure sharing links for external stakeholders like clients, investors, or partners. You can set expiration dates and control whether they can view comments or just the data.
How do notifications work to avoid spam?
Smart notifications only alert you about discussions you're directly involved in or dashboards you're following. You can customize notification preferences and choose email, in-app, or mobile alerts.