Most teams interact with their BI platform through a web interface: clicking dashboards, viewing reports, asking questions. But the real power of a modern BI platform is its API. When you treat your BI platform as a data service rather than just a visualization tool, you can embed analytics into the applications your team already uses, automate reporting workflows that currently require manual effort, and build custom integrations that connect your data to any system. This guide covers the practical patterns for API-first analytics.
What API-First Analytics Means
API-first means that everything you can do in the BI platform's user interface, you can also do programmatically through its API. Create dashboards, run queries, generate reports, manage data sources, configure alerts—all through HTTP requests that your code can automate.
This matters because the web interface is designed for humans interacting one at a time. The API is designed for systems interacting at scale. A human can generate one report at a time. An API script can generate 200 reports in minutes. A human can check one dashboard periodically. An API integration can monitor every metric continuously and trigger actions when thresholds are crossed.
Who Benefits
- Engineering teams: Embed analytics directly into internal tools and customer-facing products.
- Operations teams: Automate reporting workflows and data pipeline monitoring.
- Product teams: Build usage analytics into the product itself, powered by the BI platform's data layer.
- Agencies: Generate client reports programmatically across dozens of accounts.
- Data teams: Orchestrate data workflows that include analysis, alerting, and distribution.

Getting Started With the clariBI API
Authentication
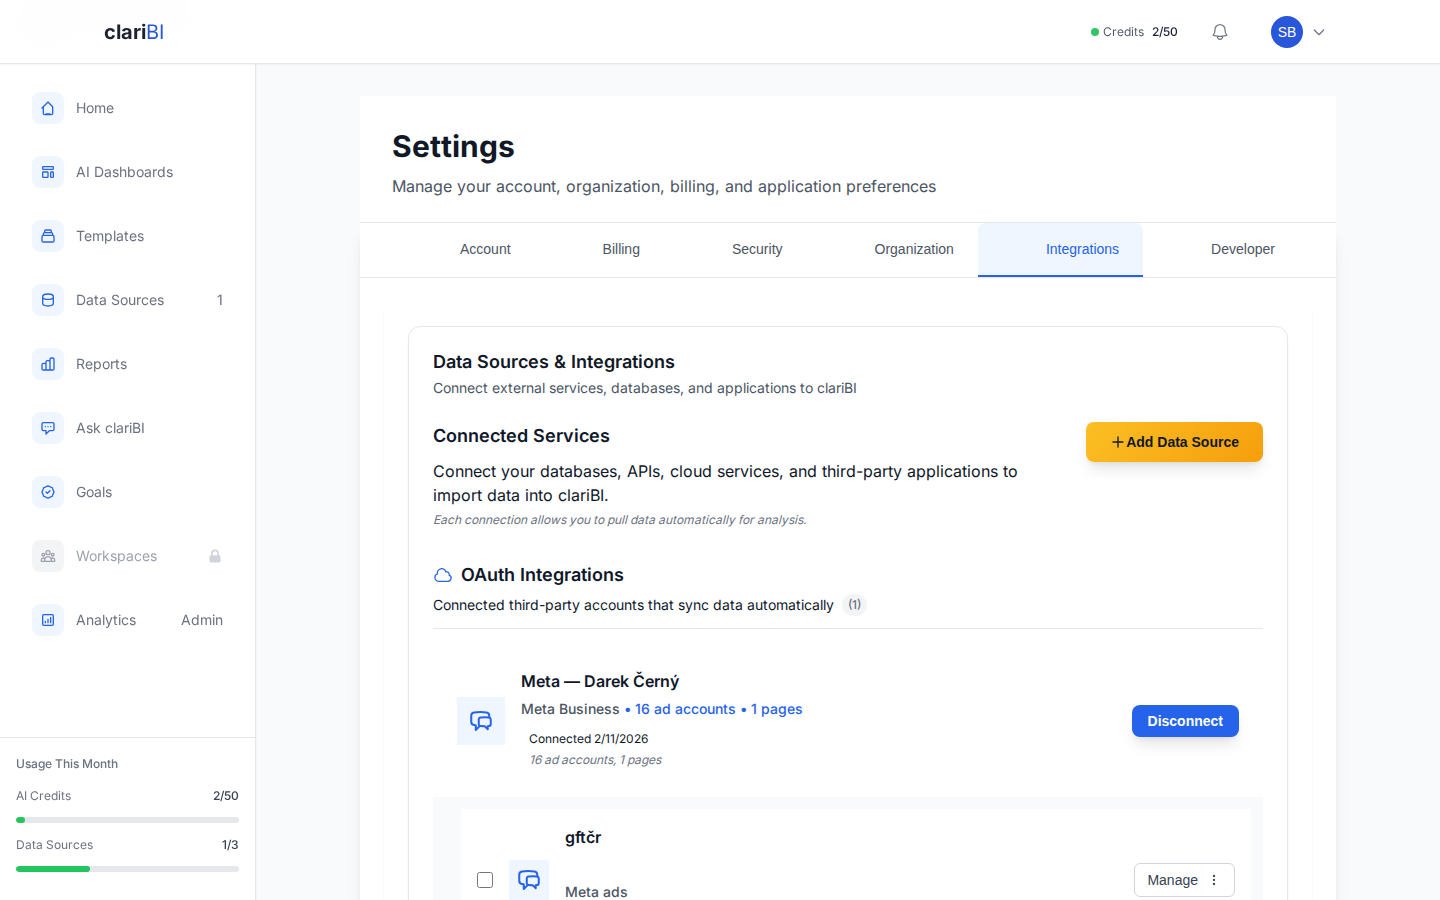
The clariBI API uses API key authentication. Generate a key from Settings > API Keys in the web interface. Each key is scoped to your organization and inherits the permissions of the user who created it. For production integrations, create a dedicated service account user with only the permissions the integration needs. See the API key management guide for step-by-step instructions.
Include the API key in the Authorization header of every request:
Authorization: Bearer your-api-key-hereRate Limits
API requests are rate-limited based on your subscription tier. Starter plans get 100 requests per minute, Professional plans get 500, and Enterprise plans get 2,000. Rate limit headers are included in every response so your code can implement proper backoff logic.
Base URL and Versioning
All API endpoints are available at https://claribi.com/api/. Include your API key in every request and refer to the API documentation for available endpoints and parameters.
Pattern 1: Embedded Analytics
Embedded analytics means displaying BI content (charts, KPIs, tables) inside another application rather than in the BI platform's own interface. This brings data to where people already work instead of asking them to switch tools.
Use Cases
- Internal admin panels: Embed revenue and usage charts directly in your admin dashboard. Developers and support staff see the data without needing a separate BI login.
- Customer-facing analytics: Show customers their usage metrics, performance data, or ROI summaries inside your product. This adds value and increases stickiness.
- CRM integration: Display account-level analytics inline in the CRM record, so sales reps see customer health data without switching tabs.
- Mobile apps: Pull chart data from the API and render it natively in a mobile application.
How It Works
There are two approaches to embedding:
iFrame Embedding: Use clariBI's public sharing feature to generate a shareable URL for a dashboard, then embed that URL in an iFrame. This is the fastest approach—no code beyond the iFrame tag. The dashboard renders exactly as it appears in clariBI, including interactive features. See the public sharing documentation for URL generation.
API-Driven Rendering: Call the API to retrieve raw data, then render it using your own visualization library (D3.js, Chart.js, Recharts, or whatever your application already uses). This gives you full control over the visual design and behavior. The data endpoint returns JSON that you can shape however you need.
Choosing Between Them
| Criterion | iFrame Embedding | API-Driven |
|---|---|---|
| Setup time | Minutes | Hours to days |
| Visual customization | Limited to clariBI themes | Full control |
| Interactivity | Full clariBI interactivity | Build your own |
| Performance | Depends on clariBI load time | Depends on your rendering |
| Authentication | Public sharing | API key or OAuth |
| Best for | Internal tools, quick wins | Customer-facing, branded experiences |
Pattern 2: Automated Reporting
Automated reporting uses the API to generate and distribute reports without human intervention. This is the highest-ROI API integration for most organizations because it replaces hours of manual work every week.
Use Cases
- Scheduled client reports: Generate and email client-specific reports every Monday morning without an analyst touching anything.
- Executive briefings: Compile KPIs from multiple dashboards into a single formatted email sent to leadership at 7 AM.
- Compliance reports: Generate required regulatory reports on schedule and archive them for audit purposes.
- Exception reports: Monitor metrics continuously and send reports only when something is outside expected ranges.
Building an Automated Report Pipeline
A typical automated report pipeline has four stages:
- Trigger: A cron job, a webhook event, or a calendar schedule initiates the pipeline.
- Data retrieval: API calls pull the latest data from relevant dashboards or data sources. Filter by date range, segment, or any other dimension.
- Report generation: Format the data into the desired output: PDF, HTML email, Slack message, spreadsheet. You can use clariBI's built-in export endpoints for PDF and CSV, or format the raw data yourself.
- Distribution: Send the report to the right people through the right channel. Email for formal reports, Slack for operational alerts, file system for archival.
clariBI also supports scheduled reports natively through the web interface, which handles all four stages without any code. Use the API approach when you need custom formatting, conditional logic, or distribution to systems that the built-in scheduler does not support. See the scheduled reports guide for the no-code option.
Pattern 3: Data Pipeline Integration
Your BI platform is not the only system that needs data. By integrating the BI API into your data pipelines, you can use the platform's analytics capabilities as a step in larger automated workflows.
Use Cases
- ETL orchestration: After a data pipeline loads new data, trigger a dashboard refresh via the API so reports reflect the latest data immediately.
- Anomaly alerting: Run a scheduled query through the API, compare results to thresholds, and trigger alerts through PagerDuty, Slack, or email when anomalies are detected.
- Data quality monitoring: Query data completeness and freshness metrics through the API and feed them into a centralized monitoring dashboard.
- Cross-System Reporting: Pull aggregated analytics from the BI platform via API and combine them with data from other systems. For example, include clariBI dashboard metrics in a custom internal reporting portal alongside data from other tools.
Event-Driven Integration via Polling
While clariBI's API supports polling for data changes, you can build webhook-like behavior by periodically checking the API for updates from your own systems. A lightweight polling script that runs on a schedule can detect changes and trigger downstream actions.
Common polling-driven workflows you can build:
- Poll for data source sync status → trigger downstream processing when complete
- Poll dashboard metrics on a schedule → send a Slack notification if values cross your defined thresholds
- Poll for new scheduled report exports → upload to a shared drive or send to an external system
Pattern 4: Custom Applications
The most advanced API use case is building custom applications on top of the BI platform's data and analytics capabilities.
Use Cases
- Custom portals: Build a branded analytics portal for customers or partners that uses clariBI as the data backend but presents a completely custom UI.
- Internal tools: Build operational tools (inventory management, capacity planning, sales forecasting) that pull real-time analytics from clariBI and combine them with application logic.
- Mobile experiences: Build native mobile apps for field teams that surface the specific metrics they need, formatted for small screens and intermittent connectivity.
- Workflow automation: Build applications that combine analytics with action: detect an anomaly, present it to a human for review, then execute a response (adjust a budget, pause a campaign, escalate a ticket).
Security Best Practices for API Integration
API integrations handle sensitive data and need to be secured properly:
- Use the principle of least privilege. Create API keys with only the permissions the integration needs. A reporting script that only reads data should not have write access to data sources or user management.
- Rotate keys regularly. Set a rotation schedule (quarterly is common) and automate the rotation process so it happens reliably.
- Never hardcode keys. Store API keys in environment variables, secrets managers (AWS Secrets Manager, HashiCorp Vault), or CI/CD platform secrets. Never commit them to version control.
- Use HTTPS exclusively. All API communication should be encrypted in transit. clariBI enforces HTTPS on all API endpoints.
- Implement proper error handling. API calls can fail due to rate limits, network issues, or authorization problems. Your code should handle these gracefully: retry with exponential backoff for transient errors, alert on persistent failures, and never expose raw API errors to end users.
- Log API usage. Track which integrations call which endpoints, how often, and what data they access. clariBI's audit logging covers API access. See the audit logging documentation for details on API activity tracking.
Getting Started: A Practical First Project
If you have not used the clariBI API before, start with a small project that delivers immediate value:
- Pick a manual report that someone generates weekly. Something that takes 1-2 hours and follows a predictable format.
- Map the data sources. Identify which clariBI dashboards or data sources provide the data for that report.
- Write a script. Use your preferred language (Python, JavaScript, Ruby—any language with HTTP support works) to call the API, retrieve the data, format it, and output the report.
- Schedule it. Use a cron job, a CI/CD pipeline scheduled trigger, or a workflow automation tool to run the script on the same schedule the report was manually generated.
- Validate. Run the automated report alongside the manual report for two weeks. Compare the outputs. Fix any discrepancies.
- Replace. Once validated, retire the manual process. Redirect the freed-up time to higher-value work.
This first project typically takes a day or two and saves 1-2 hours per week going forward. More importantly, it establishes the pattern and builds confidence for larger API integration projects.
For complete API reference documentation including all available endpoints, request and response formats, and code examples, visit the API documentation in the knowledge base.
Conclusion
A BI platform with a strong API is more than a reporting tool. It is a data layer that your entire organization can build on. Embedded analytics brings insights to where people work. Automated reporting eliminates manual effort. Pipeline integration connects analytics to operational systems. And custom applications create entirely new capabilities powered by your data. Start with one high-value automation, prove the pattern, and expand from there. The API is the difference between a tool that a few analysts use and a platform that the entire organization runs on.