What You Will Need
- A clariBI account (even a free trial works)
- A data file -- CSV, Excel (.xlsx), or PDF with tabular data
- About five minutes
Step 1: Upload Your Data
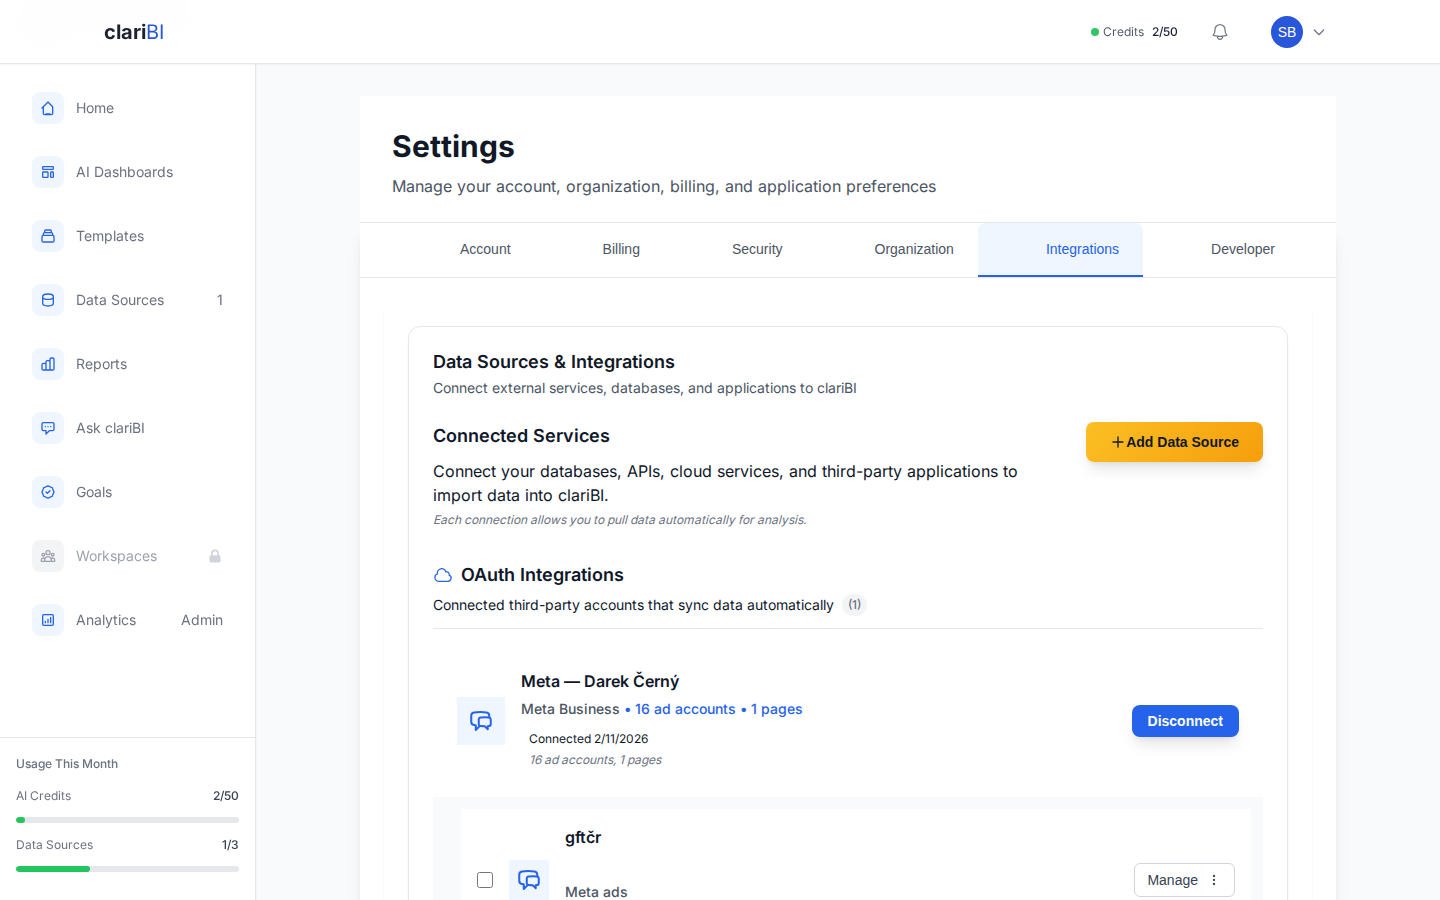
From the sidebar, click Data Sources, then click Add Source.
Under Direct Upload, select CSV File or Excel File. Enter a name for the connection, then drag and drop your file onto the upload area or click to browse.
clariBI automatically detects the file format, column names, and data types. You will see a preview table showing the first ten rows. Verify that columns look correct and click Connect.
Supported File Sizes
| Plan | Max File Size |
|---|---|
| Trial | 10 MB |
| Starter | 10 MB |
| Professional | 100 MB |
| Enterprise | 1 GB |
If your file exceeds the limit, consider connecting directly to the database or upgrading your plan.
Step 2: Choose an Analysis Template
After the file is connected, clariBI suggests analysis templates that fit your data shape. For example, if your CSV has date and revenue columns, you might see:
- Revenue Trend Analysis
- Monthly Performance Summary
- Growth Rate Calculation
Pick one that matches what you want to learn, or select Custom Analysis to write your own prompt.
For the full template catalog, see Analysis Templates: Browse, Run, Customize.
Step 3: Run the Analysis
Click Run Analysis. The AI processes your data and produces results in 10 to 30 seconds depending on dataset size. This costs one AI credit.
While the analysis runs, you will see a progress indicator. Do not navigate away -- the results appear on the same page.
Step 4: Review the Report
The finished report contains several sections:
Executive Summary
A two- to three-paragraph overview of the key findings. Written in plain language, not technical jargon.
Key Findings
Bullet-pointed observations backed by specific numbers from your data. For example: "Revenue grew 18% month-over-month in Q3, driven primarily by the Enterprise segment."
Visualizations
The AI recommends chart types based on your data and findings. Common choices include line charts for trends, bar charts for comparisons, and pie charts for composition breakdowns. Each chart includes a confidence score showing how well the chart type fits the data.
Recommendations
Actionable suggestions based on the findings. These are not generic advice -- they reference specific patterns in your data.
Step 5: Save or Export
Once you are satisfied with the report:
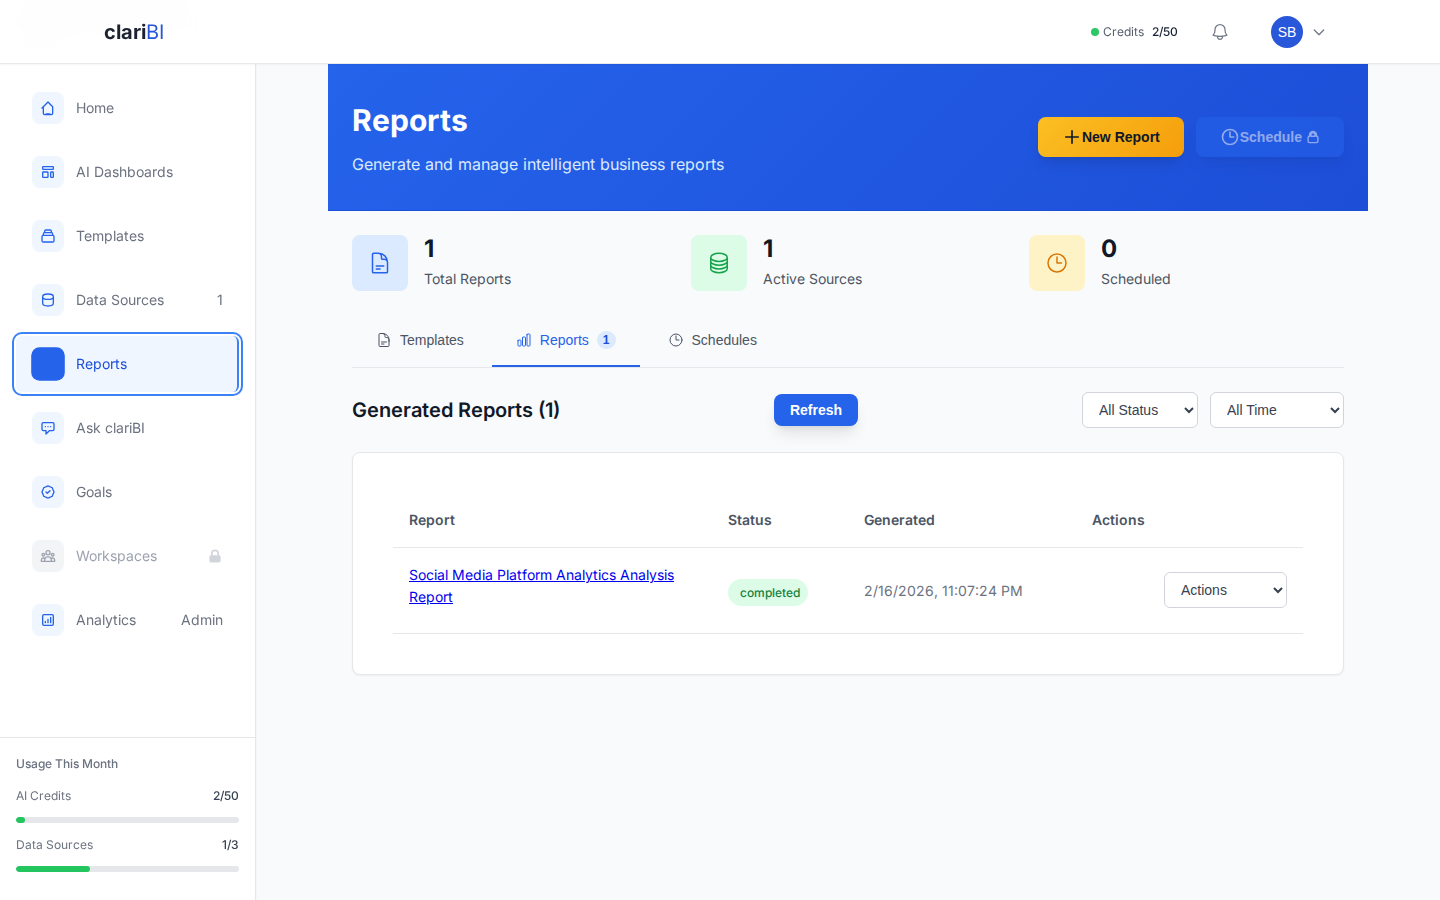
- Click Save Report to add it to your Reports list.
- Click Export to download as PDF (Professional plan and above). Excel and CSV export is available for data tables.
- Click Share to generate a public link (Professional plan and above) or send it to a team member.
For more on export options, see Export Formats: PDF, Excel, CSV Configuration.
What to Try Next
- Ask follow-up questions -- open the AI Analytics chat and ask something like "Why did revenue dip in March?" referencing the same data source.
- Create a dashboard -- turn your findings into a visual dashboard. See Creating a Dashboard Step by Step.
- Schedule recurring reports -- if this data updates regularly, set up a schedule so the report regenerates automatically. See Scheduling Reports.
Troubleshooting
The upload fails: Check that your file is CSV, XLSX, or PDF and within the size limit for your plan.
Columns are misidentified: On the preview screen, click any column header to change its data type (text, number, date, boolean).
The analysis takes longer than a minute: Large files with 100,000+ rows take more processing time. If it exceeds two minutes, try reducing the dataset or contacting support.
See full documentation for advanced file upload options.