What Are Analysis Templates?
Analysis templates are pre-written AI prompts designed for specific business questions. Instead of writing your own question from scratch, you pick a template, connect it to your data, and the AI runs the analysis using a proven prompt structure.
Think of templates as recipes -- they define the ingredients (required data fields) and the steps (analysis logic), and you supply the data.
Browsing the Template Library
Where to Find Templates
You can access templates from two places:
- AI Analytics > Templates tab -- the full template browser
- After connecting a data source -- clariBI suggests templates that match your data structure
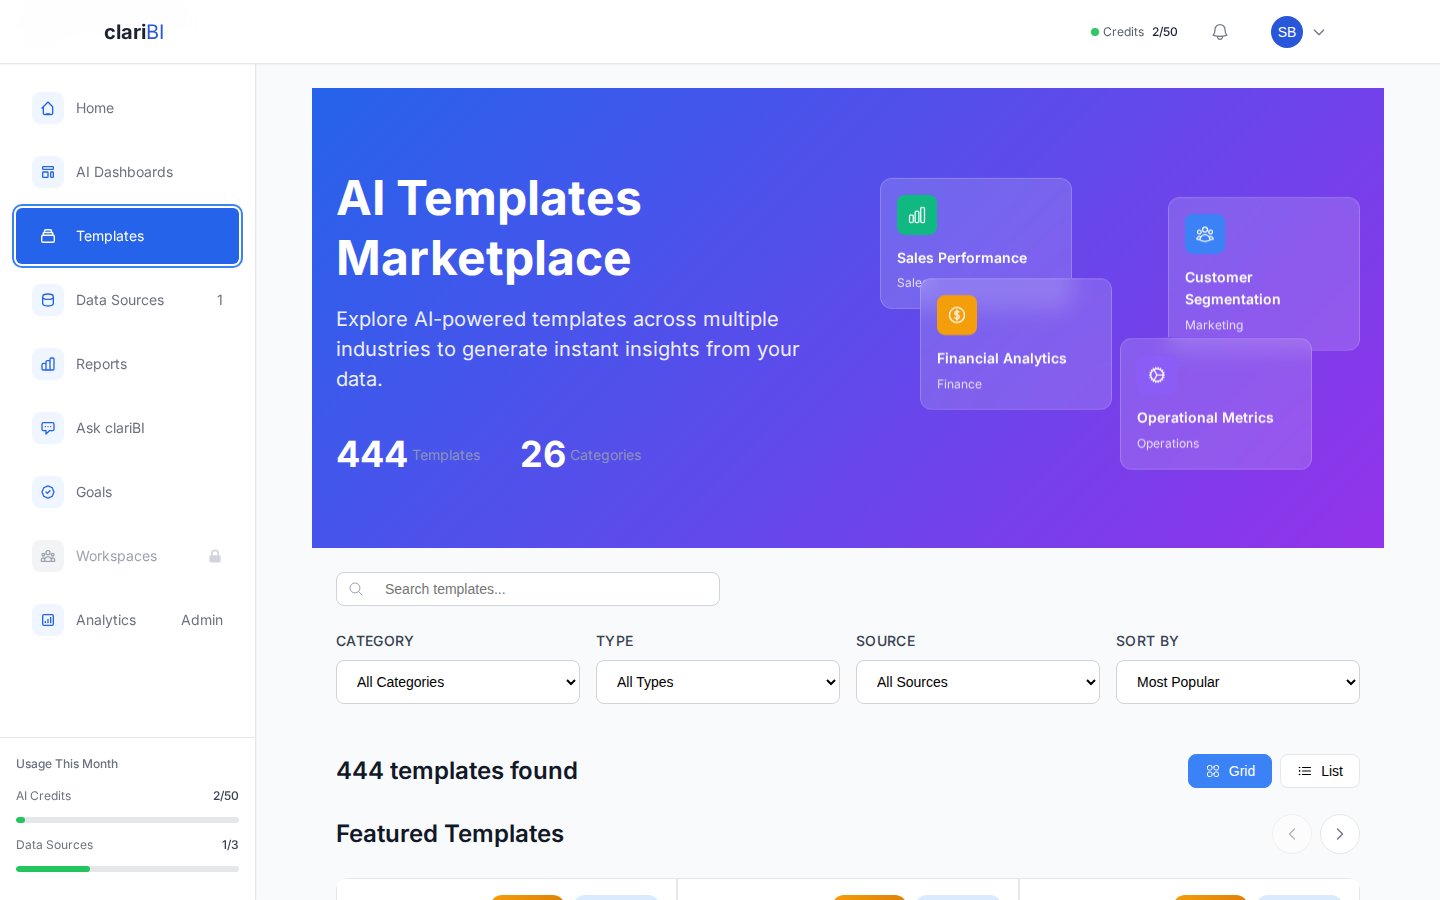
Template Library Interface
The library shows template cards with:
- Template name and a one-line description
- Category badge (Sales, Marketing, Finance, etc.)
- Required data fields (e.g., "needs a date column and a revenue column")
- Estimated credit cost (usually 1)
- Difficulty indicator
Filtering and Search
- Search by keyword: type "churn" to find churn-related templates
- Filter by category: Sales, Marketing, Finance, Operations, HR, Product, Customer Support, Executive, IT, Project Management, Retail, SaaS, Healthcare, Real Estate, E-commerce, and more
- Filter by data source type: Database, CSV/Excel, Google Analytics, Jira, Google Sheets, REST API
- Sort by: Most popular, newest, alphabetical
Template Categories Overview
clariBI organizes templates across 30+ categories. Here are some of the largest:
| Category | Example Templates | Count |
|---|---|---|
| Sales | Revenue Trend, Pipeline Analysis, Win/Loss Analysis, Quota Attainment | 25+ |
| Marketing | Campaign ROI, Channel Comparison, Funnel Analysis, Traffic Source Analysis | 20+ |
| Finance | Cash Flow, Budget Variance, Expense Analysis, Revenue Forecasting | 20+ |
| Operations | Inventory Optimization, Supply Chain, Fulfillment Analysis, Quality Control | 15+ |
| HR | Turnover Analysis, Headcount Planning, Compensation Benchmarking | 15+ |
| Product | Feature Usage, Retention Cohorts, User Segmentation, NPS Analysis | 15+ |
| SaaS | MRR Analysis, Churn Prediction, LTV Calculation, ARR Growth | 12+ |
| E-commerce | Cart Abandonment, Product Performance, Seasonal Trends | 10+ |
| Customer Support | Ticket Volume, Resolution Time, CSAT Trend, Escalation Analysis | 10+ |
Running a Template
Step 1: Select a Template
Click a template card to open it. The detail view shows:
- Full description of what the template analyzes
- The specific questions it answers
- Required data fields
- Sample output preview
Step 2: Connect Your Data
Click Run This Template. The setup screen asks you to:
- Select a data source from your connected sources
- Map required fields -- match the template's expected fields to your actual column names
For example, a "Revenue Trend Analysis" template requires:
- A date field (mapped to your order_date or transaction_date column)
- A revenue field (mapped to your amount or revenue column)
- An optional category field (mapped to your product_category or region column)
Step 3: Customize Parameters
Many templates have adjustable parameters:
- Date range -- last 30 days, last 12 months, custom
- Grouping -- daily, weekly, monthly, quarterly
- Filters -- limit to specific categories, regions, or segments
- Top N -- show top 5, 10, or 20 results
Step 4: Run
Click Run Analysis. The AI processes your data using the template's prompt structure and returns results in 10-30 seconds. This costs one AI credit (some complex templates cost 2).
Reading Template Results
Template results follow a consistent structure:
Executive Summary
A 2-3 paragraph overview of the key findings.
Key Metrics
The most important numbers pulled from the analysis, displayed as metric cards.
Visualizations
Charts and graphs selected by the AI based on the data. Templates often pre-specify chart types that work well for their question type.
Detailed Findings
Bullet-pointed observations with supporting data.
Recommendations
Actionable suggestions based on the analysis.
Saving Results
After running a template, you can:
- Save as Report -- adds the analysis to your Reports list with all sections
- Add to Dashboard -- creates widgets from the key charts and metrics
- Export -- download as PDF, Excel, or CSV
- Re-run Later -- the template configuration is saved so you can re-run with the same settings (or adjusted parameters)
Customizing Templates
Editing Parameters Before Running
You can modify any parameter before clicking Run. Change the date range, add filters, or adjust the grouping. The template adapts its analysis accordingly.
After Running -- Ask Follow-ups
After a template runs, the results appear in the conversational analytics interface. You can ask follow-up questions that build on the template's analysis:
- "Break this down by region"
- "What caused the dip in March?"
- "How does this compare to the same period last year?"
Creating Custom Templates (Enterprise Plan)
Enterprise users can create custom templates:
- Write a prompt that references data field placeholders
- Define required and optional input fields
- Set default parameters
- Test against sample data
- Publish to your organization's template library