The most useful report is one that arrives without being asked for. Instead of someone spending Monday morning pulling last week's numbers into a spreadsheet and emailing it around, automated reports do the work overnight and land in inboxes before the first coffee is poured. This tutorial walks through setting up a weekly automated report in clariBI from scratch.
What You Will Build
By the end of this tutorial, you will have a weekly report that:
- Runs automatically every Monday at 7:00 AM
- Pulls the latest data from your connected data sources
- Includes KPI summaries, trend charts, and exception callouts
- Delivers via email to a list of recipients you define
- Requires zero manual effort after initial setup
Prerequisites
- At least one data source connected in clariBI (database, CSV, or API). If you have not connected a data source yet, see the data source connection guide.
- An existing dashboard with the metrics you want to include in the report. If you need to build one first, follow the dashboard creation guide.
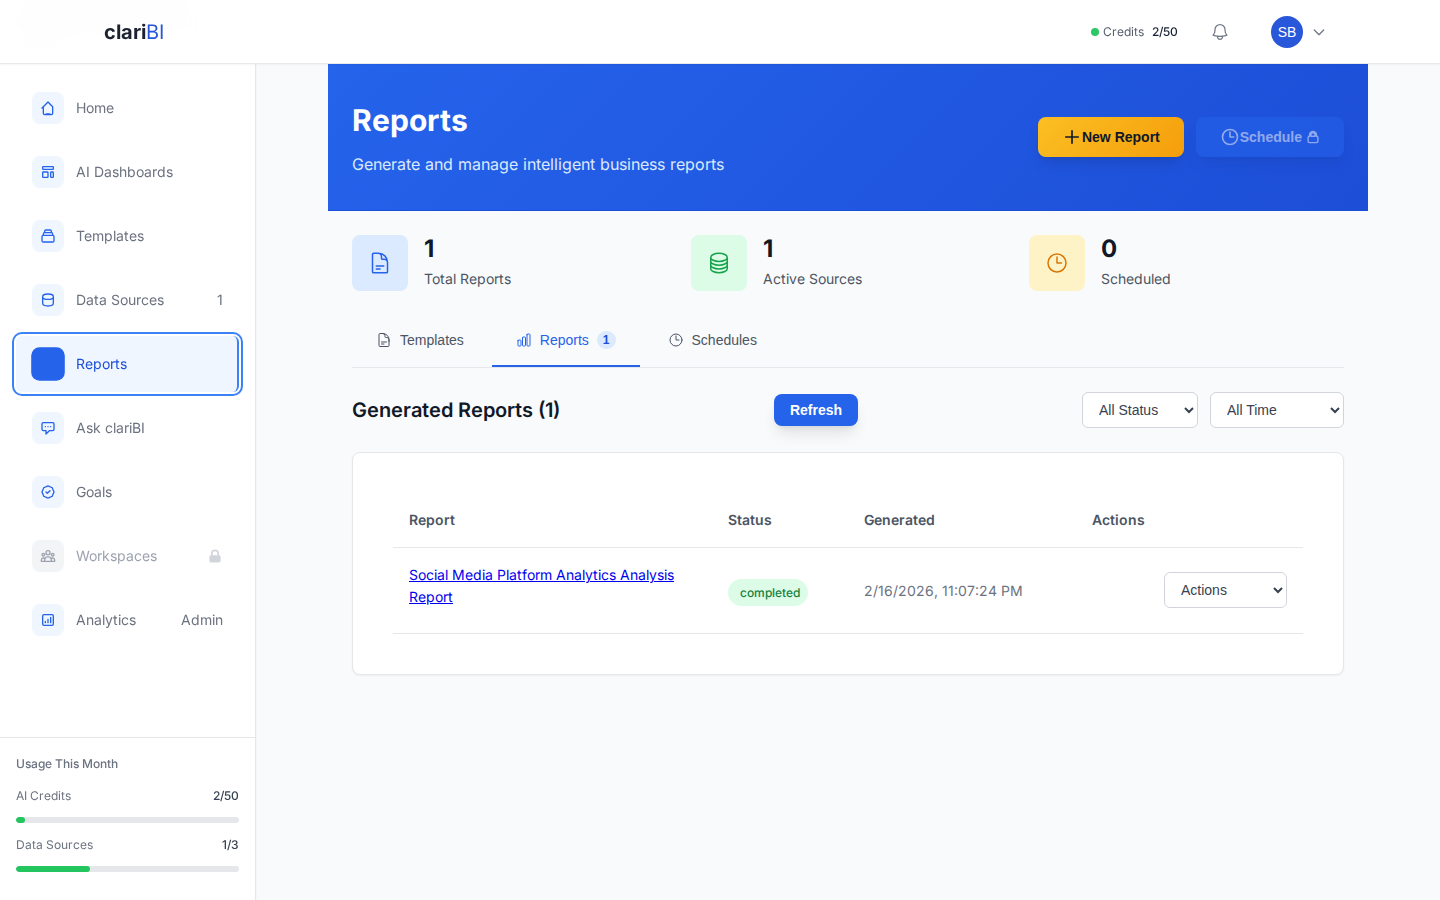
Step 1: Create the Report Template
- Navigate to Reports in the left sidebar
- Click Create Report
- Choose a name that clearly identifies the report and its cadence: "Weekly Business Review - Week of [date]" works well
- Select the data source(s) that power this report
Building the Report Content
A good weekly report follows the structure described in our weekly business review guide:
Section 1: KPI Scorecard
- Add 5-8 KPI summary cards showing current values, comparison to prior week, and target status
- Include color indicators: green for on-track, yellow for watch, red for needs attention
Section 2: Trend Charts
- Add 2-3 line charts showing the most important metrics over the last 8-12 weeks
- Include target lines where applicable so recipients can see performance against plan
Section 3: Exceptions and Highlights
- Add a section that calls out any metrics that crossed a threshold this week
- Include notable wins (milestones hit, records broken) and concerns (metrics deteriorating)
Section 4: Detailed Table (Optional)
- For teams that want the numbers behind the charts, add a data table with key metrics by segment, product, or region
Step 2: Configure the Schedule
- In the report editor, click the Schedule tab
- Set the frequency to Weekly
- Select Monday as the delivery day
- Set the delivery time to 7:00 AM (or whenever your team typically starts their day)
- Choose the timezone that matches your team's primary location
The report will run at the scheduled time, pulling fresh data from all connected sources. If a data source is temporarily unavailable, clariBI will retry and note the data freshness in the report.
Step 3: Add Recipients
- Click the Delivery tab in the report editor
- Select Email as the delivery method
- Add the email addresses of everyone who should receive the report
- Optionally, add a custom subject line: "Weekly Business Review - [Auto-generated date]" helps recipients find the report in their inbox
- Optionally, add a brief introduction message that appears at the top of the email
Managing Recipients
- You can add individual email addresses or groups
- Recipients do not need to have clariBI accounts to receive email reports - the report content is embedded in the email
- For recipients who want to drill deeper, include a link to the live dashboard in the email footer
Step 4: Send a Test
Before activating the schedule, send a test report:
- Click Send Test in the report editor
- Select your own email address as the recipient
- Check your inbox to verify:
- The report arrived and renders correctly in your email client
- Charts are legible and properly formatted
- KPI values are current and match your dashboard
- The layout works on both desktop and mobile email
If anything needs adjustment, edit the report template and send another test until it looks right.
Step 5: Activate the Schedule
- Once the test looks good, go back to the Schedule tab
- Toggle the schedule to Active
- Click Save
The report is now live. It will run automatically every Monday at the time you specified and deliver to all recipients via email.
Advanced Configuration
Multiple Schedules
You can create different reports with different schedules for different audiences:
- Executive weekly report: High-level KPIs, delivered Monday 7:00 AM to leadership
- Sales daily report: Pipeline and activity metrics, delivered every morning to the sales team
- Monthly deep-dive: Detailed analysis with commentary, delivered the first business day of each month to the full company
Conditional Alerts
In addition to scheduled reports, set up alert-based notifications that fire when a metric crosses a threshold. For example, get an email immediately when:
- Daily revenue drops more than 20% below the trailing 7-day average
- A data source connection fails
- Churn rate exceeds the monthly target
Alerts complement scheduled reports - the schedule provides regular context, while alerts provide immediate notification of exceptions.
Report Formats
clariBI supports multiple delivery formats:
- Embedded email: Charts and data rendered directly in the email body. Best for quick review without opening attachments.
- PDF attachment: A formatted PDF attached to the email. Best for archiving or printing.
- Dashboard link: An email with a summary and a link to the live, interactive dashboard. Best for teams that want to explore the data further.
Maintenance and Iteration
- Review quarterly: Ask recipients if the report still contains the right metrics. Business priorities change, and the report should change with them.
- Check delivery logs: Periodically verify that reports are being delivered successfully. Check for bounced emails or failed data refreshes.
- Keep the recipient list current: Remove people who leave the team and add new members during onboarding.
- Watch for report fatigue: If the report is too long or arrives too frequently, people stop reading it. Keep it focused on the metrics that drive weekly decisions.
Automated reports are one of the highest-return features in any BI tool. The setup takes about 30 minutes, and from that point forward, your team gets consistent, accurate, timely data every week without anyone lifting a finger. That consistency is what turns data awareness from an occasional event into a daily habit.