The promise of self-service BI is that business users can answer their own data questions without waiting for an analyst. The reality is more complicated. Some organizations thrive with self-service. Others invest in self-service tools and end up with a mess of conflicting reports and confused users. This article breaks down the honest trade-offs and helps you decide which model fits your team.
Defining the Two Models
Traditional Reporting
In the traditional model, a centralized analytics or BI team owns data access, report creation, and metric definitions. Business users submit requests, analysts build reports, and the finished product gets delivered - usually as a scheduled report or a dashboard the analyst maintains.
How it works in practice:
- Marketing manager needs conversion data by channel for last quarter
- Submits a request to the analytics team
- Analyst writes the query, validates the data, builds the visualization
- Delivers the report in 2-5 business days
- Marketing manager reviews, asks follow-up questions, analyst iterates
Self-Service BI
In the self-service model, business users have direct access to data through a BI tool and can build their own reports, dashboards, and analyses. The analytics team focuses on data infrastructure, metric definitions, and governance rather than report building.
How it works in practice:
- Marketing manager opens the BI tool
- Selects the pre-built marketing data model
- Drags "conversion rate" and "channel" onto the canvas, filters to last quarter
- Gets the answer in 5 minutes
- Asks a follow-up question by adding a new dimension to the view

The Case for Self-Service BI
Speed
This is the primary advantage. When a business user can answer a question in 5 minutes instead of waiting 3 days, they make faster decisions. In competitive markets, the speed of decision-making is itself a competitive advantage.
Better Use of Analyst Time
When self-service handles the routine "how many" and "what happened" questions, analysts can focus on the harder "why" and "what should we do" questions. This is a better use of expensive analytical talent. Instead of pulling reports all day, analysts build data models, investigate root causes, and develop strategic recommendations.
Data Curiosity
When data is easy to access, people ask more questions. A marketing manager who can slice conversion data by campaign, channel, geography, and device will discover patterns that a pre-built report never anticipated. This exploratory analysis often surfaces the most valuable insights.
Scale
A three-person analytics team cannot serve a 500-person company with traditional reporting. The request queue grows indefinitely, and critical questions wait behind trivial ones. Self-service scales because each new user generates their own answers.
The Case for Traditional Reporting
Data Accuracy
When a trained analyst builds every report, the numbers are more likely to be correct. They know which tables to join, which filters to apply, which edge cases to handle. When 50 business users each build their own version of "revenue last quarter," you often end up with 50 different numbers.
Metric Consistency
In traditional reporting, the analytics team defines metrics once and applies them consistently. "Active user" means the same thing in every report. In poorly governed self-service environments, different departments define the same metric differently, leading to conflicting numbers in leadership meetings.
Data Security
Fewer people with data access means fewer potential exposure points. When every employee can query the database, the risk of sensitive data being exported, shared inappropriately, or accidentally exposed increases. Traditional reporting keeps data access contained.
Lower User Burden
Not everyone wants to learn a BI tool. Many business users prefer receiving a finished report and focusing on their actual job. Forcing self-service on people who do not want it creates frustration, not productivity.
The Hybrid Model: What Actually Works
Most successful organizations do not pick one model exclusively. They run a hybrid where the approach matches the use case and the user.
Layer 1: Governed Metrics and Standard Reports (Traditional)
The analytics team defines the official metrics, builds the core dashboards, and manages the data models. These are the "source of truth" reports that leadership uses for decision-making. Nobody modifies these except the analytics team.
Examples: Executive scorecard, monthly board report, financial close report, regulatory compliance reports.
Layer 2: Curated Self-Service (Guided Self-Service)
The analytics team creates data models with pre-defined dimensions and measures that business users can explore freely. Users can slice, filter, and pivot the data, but they are working within a governed data model where the metric definitions are baked in. This prevents the "50 different revenue numbers" problem.
Examples: Marketing campaign analysis, sales pipeline exploration, support ticket investigation.
Layer 3: Open Exploration (Full Self-Service)
A smaller group of power users - typically data-savvy individuals in each department - has broader access to explore data freely, build ad-hoc analyses, and prototype new metrics. These users act as bridges between the analytics team and their department.
Examples: Ad-hoc root cause analysis, prototype dashboards, experimental metrics.
Evaluating Self-Service Readiness
Before investing in self-service BI, assess your organization honestly on these dimensions:
Data Infrastructure
Self-service only works if the underlying data is clean, well-organized, and documented. If your data warehouse is a mess of undocumented tables with no consistent naming conventions, giving business users access will create confusion, not insight.
Data Literacy
Can your intended users read a chart correctly? Do they understand the difference between correlation and causation? Can they apply appropriate filters without accidentally excluding important data? If the answer is "some can, some cannot," plan for training and start self-service with the capable group first.
Governance Appetite
Self-service without governance is a recipe for chaos. Someone needs to define and enforce metric standards, certify official dashboards, and manage data access. If your organization does not have the appetite for governance, traditional reporting may produce better outcomes.
Tool Usability
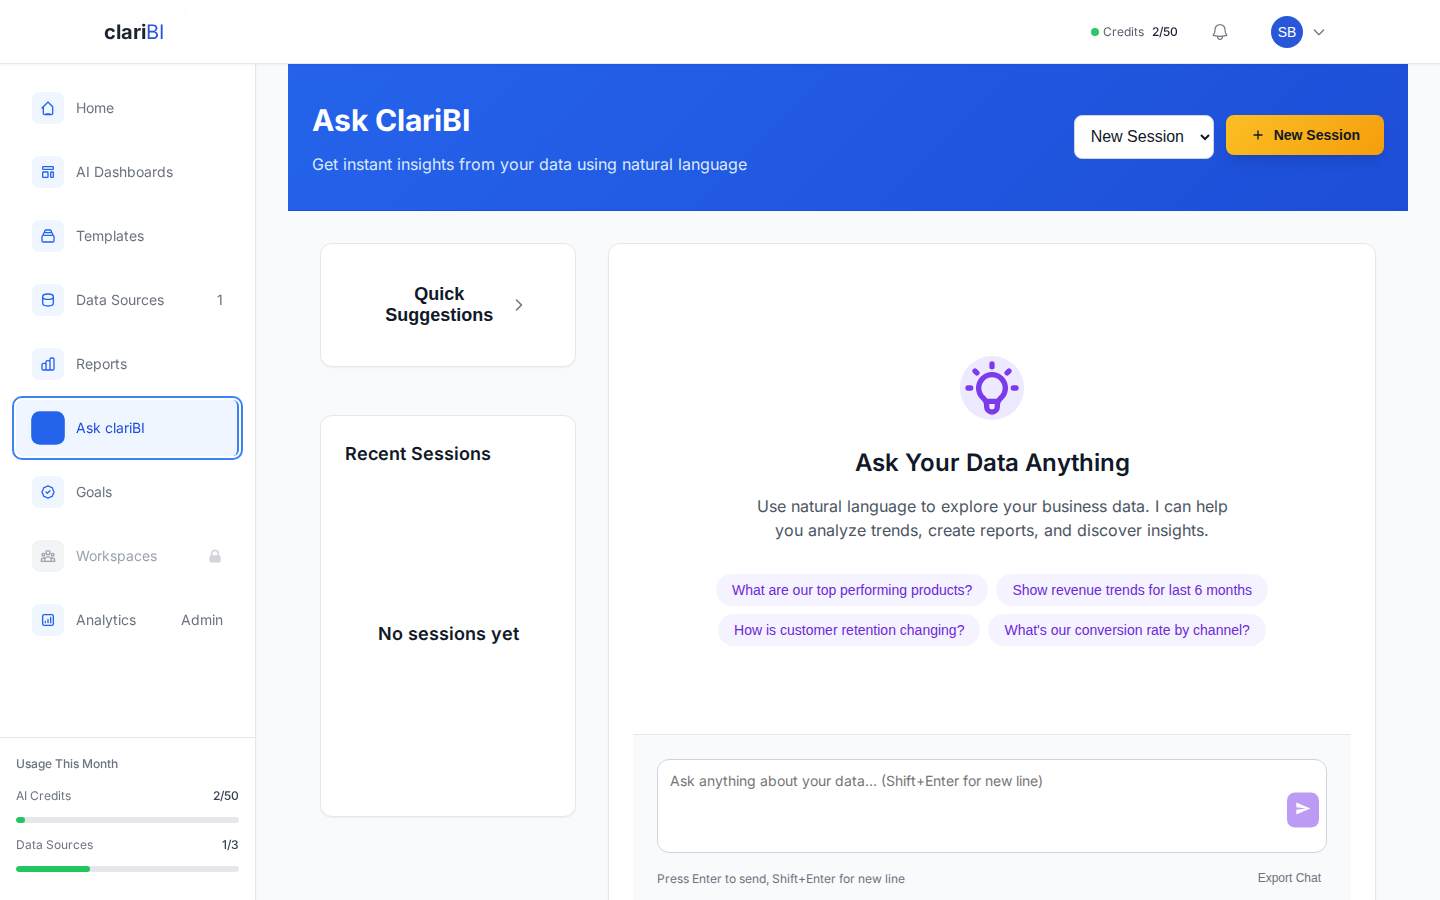
The BI tool matters. A tool that requires SQL knowledge is not truly self-service for most business users. A tool with natural language query capability - like clariBI's conversational interface - dramatically lowers the barrier. When a marketing manager can type "show me conversion rate by channel for Q3" and get an answer, self-service becomes accessible to people who would never learn SQL.
Implementation Recommendations
If You Are Starting From Scratch
- Begin with traditional reporting to establish governed metrics and build trust in the data
- Identify 5-10 power users across departments who are eager and capable
- Give those power users guided self-service access with a curated data model
- Expand self-service as you validate the governance model and build data literacy
If You Have Existing BI and Want to Add Self-Service
- Audit your current metrics - do different teams calculate the same thing differently? Fix that first.
- Build a governed semantic layer or data model that encodes metric definitions
- Deploy self-service on top of the governed layer, not directly against raw tables
- Create a certification process for user-built dashboards that become widely used
If Self-Service Has Already Been Deployed and It Is Messy
- Identify the 10 most-used dashboards and reports across the organization
- Have the analytics team validate, correct, and certify those 10 reports
- Archive uncertified duplicates and redirect users to the certified versions
- Implement governance going forward: certified vs. exploratory, metric definitions, access controls
What clariBI Offers for Both Models
clariBI supports both traditional and self-service approaches:
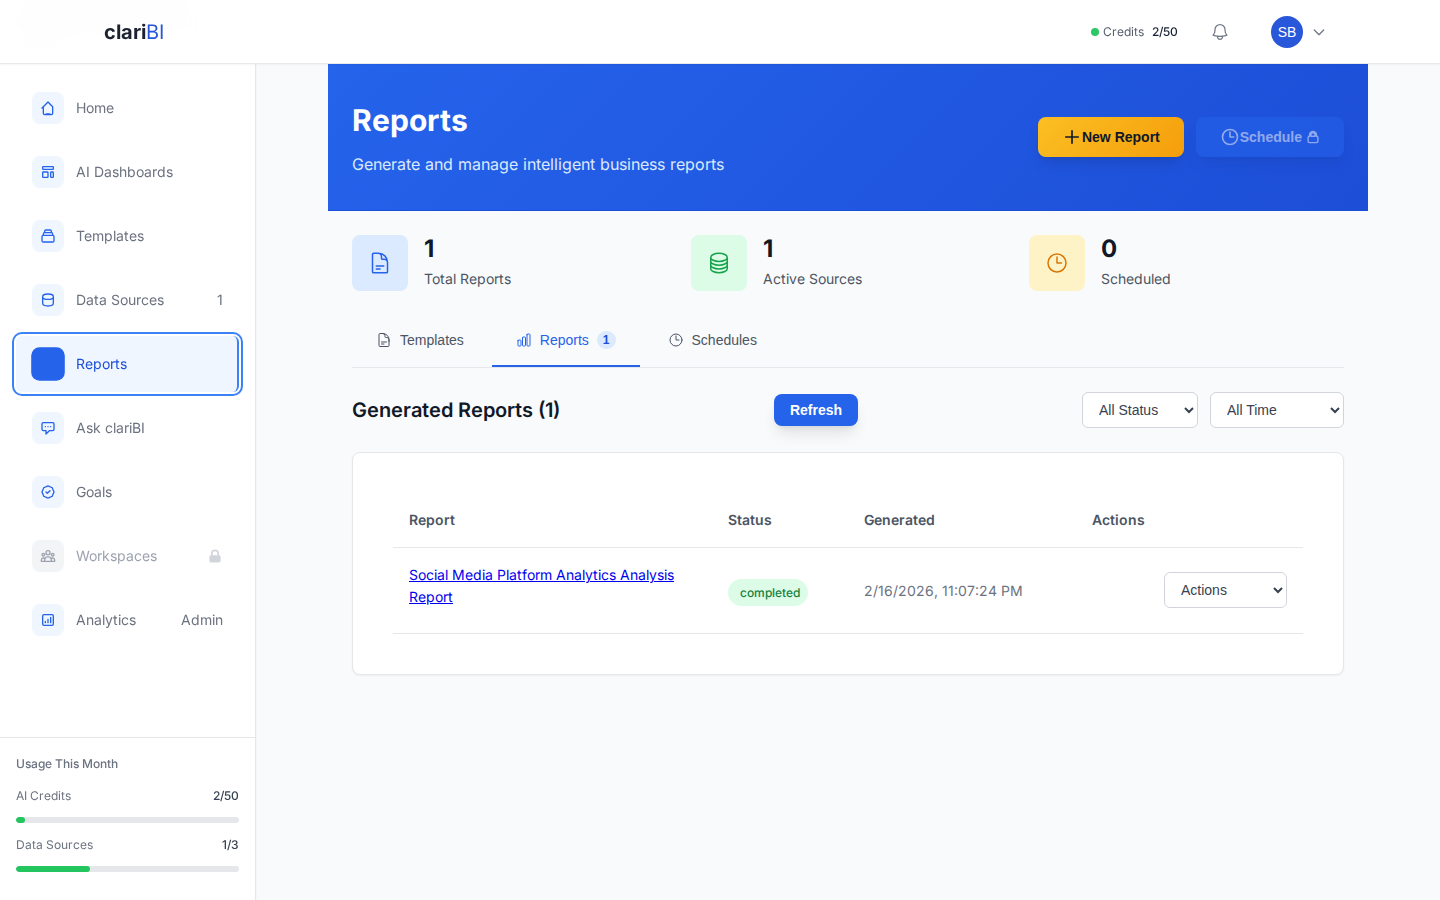
- For traditional reporting: Scheduled reports with email delivery, dashboard sharing with view-only permissions, centralized metric definitions through the template system. See the scheduled reports guide for details.
- For self-service: Natural language query interface that does not require SQL knowledge, AI-recommended visualizations, and role-based access control that limits data visibility by department.
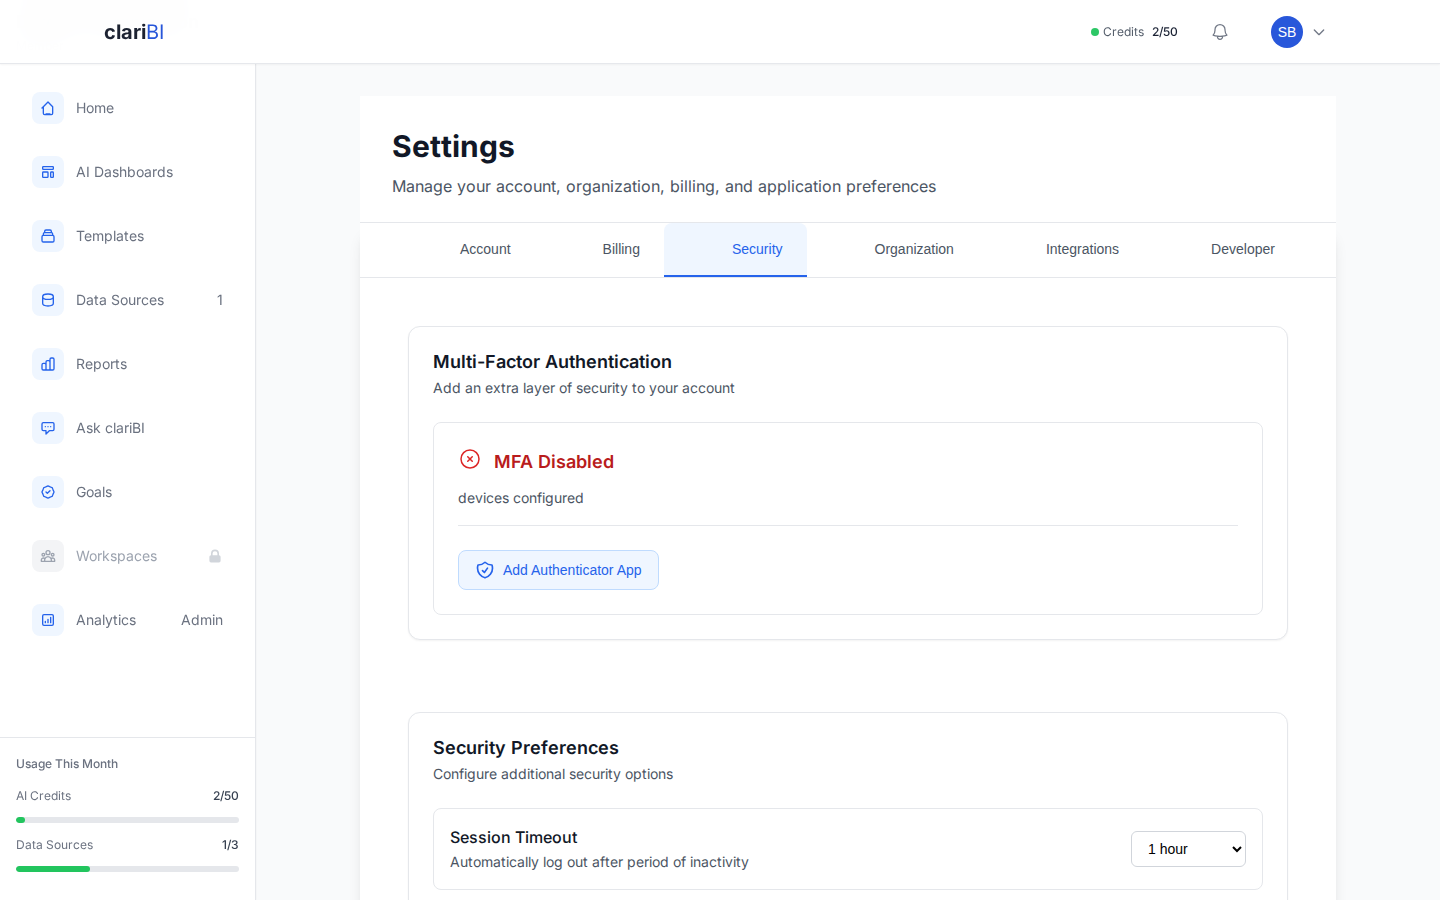
- For governance: RBAC with five permission tiers, audit logging of data access, and the ability to designate certified dashboards. Review the RBAC documentation for access control configuration.
The right question is not "self-service or traditional?" It is "which model for which use case, and how do we govern the whole thing?" Start with governance, expand self-service incrementally, and always keep a centralized source of truth for the metrics that matter most.