Data governance has an image problem. It sounds bureaucratic, expensive, and like something only Fortune 500 companies need. In reality, the growing companies that ignore data governance are the ones that suffer the most. When you go from 20 to 200 employees and your data is a mess—different definitions for the same metric, no one knows where data lives, sensitive information is accessible to everyone—cleaning it up is exponentially harder than getting it right from the start. This guide gives you a practical, lightweight governance framework that grows with your company.
What Data Governance Actually Means
Strip away the jargon, and data governance comes down to answering five questions:
- What data do we have? (Inventory)
- What does it mean? (Definitions)
- Who is responsible for it? (Ownership)
- Who can access it? (Controls)
- How good is it? (Quality)
That is it. Everything else—policies, committees, tools, audits—exists to maintain reliable answers to these five questions as your company and data grow.
Why Growing Companies Need Governance Now
The 50-Person Threshold
Somewhere around 50 employees, informal knowledge stops working. In a 15-person startup, everyone knows that "revenue" means the Stripe dashboard number and that Sarah keeps the customer list in a Google Sheet. At 50 people, new hires do not know this. They pull "revenue" from the CRM (which includes free trials) and get a number 30% higher than what finance reports. Nobody notices for two months. A board presentation uses the wrong number. Trust erodes.
This is not hypothetical. It happens at nearly every growing company that has not established basic governance. The symptoms vary—conflicting dashboards, meetings spent arguing about definitions, embarrassing errors in external reports—but the root cause is the same: no shared source of truth.
Regulatory Pressure Is Increasing
GDPR, CCPA, SOC 2, HIPAA, PCI DSS. The regulatory landscape for data handling has expanded dramatically, and the penalties for non-compliance are significant. Even companies that are not subject to industry-specific regulations face general data protection requirements. Governance provides the framework to meet these requirements systematically rather than scrambling when an audit is announced.
Data Debt Compounds
Like technical debt, data debt compounds. Every month without governance adds more inconsistencies, more undocumented data sources, more access control gaps, and more assumptions baked into reports that nobody remembers. Cleaning this up later costs 10-100 times more than preventing it.

Pillar 1: Data Inventory
You cannot govern what you do not know about. A data inventory is a catalog of every data source, dataset, and significant data asset in your organization.
What to Include
For each data source, document:
- Name and description: What is this data source? What system generates it?
- Location: Where does the data live? Database, SaaS platform, spreadsheet, API?
- Owner: Who is responsible for this data source? (More on ownership in Pillar 3.)
- Sensitivity level: Public, internal, confidential, or restricted? This drives access controls.
- Update frequency: Real-time, daily, weekly, monthly, ad-hoc?
- Key fields: What are the important columns or data points?
- Known issues: Any data quality problems, coverage gaps, or caveats?
Start With What Matters
Do not try to inventory everything at once. Start with the data sources that feed your most important dashboards and reports. In clariBI, this is straightforward: go to Settings > Data Sources and you already have a list of every connected source with metadata about connection type, sync frequency, and last sync time. Build your inventory around this list and expand from there.
A simple spreadsheet works fine for the initial inventory. As you grow past 20-30 data sources, consider a dedicated data catalog tool. But do not let tooling decisions delay the inventory itself.
Pillar 2: Metric Definitions
Metric definitions are the single highest-value governance activity for a growing company. Get this right and half your data arguments disappear.
The Metric Definition Template
For each business metric, document:
- Metric name: The official name (e.g., "Monthly Recurring Revenue")
- Abbreviation: Commonly used short form (e.g., "MRR")
- Definition: Precise, unambiguous description. "The total value of all active paid subscriptions at the end of the calendar month, excluding one-time charges, credits, and taxes."
- Calculation: The formula or query logic. If it is complex, include the SQL or pseudocode.
- Data source: Where the data comes from. Which system, which table, which field.
- Granularity: Time period (daily, weekly, monthly), entity level (per customer, per product, per region).
- Owner: Who maintains this metric definition and resolves disputes about it.
- Related metrics: Other metrics that are often confused with this one, with explanations of the differences.
Common Metrics That Need Clear Definitions
These metrics cause confusion in almost every company:
- Revenue: Bookings vs. recognized revenue vs. billed revenue vs. collected revenue. These can differ by 20-40% and are all called "revenue" by different teams.
- Churn: Logo churn vs. revenue churn vs. gross churn vs. net churn. A company can have 5% logo churn and negative net revenue churn simultaneously.
- Active users: What counts as "active"? Logged in? Performed a specific action? Within what time window?
- Conversion rate: Visitor to signup? Signup to paid? Trial to paid? The numerator and denominator matter enormously.
- Customer acquisition cost: Does it include salaries? Which salaries? Over what time period?
In clariBI, you can add metric definitions directly to dashboard widgets as descriptions that appear on hover. This keeps the definitions visible exactly where people encounter the numbers. See the dashboard widgets guide for instructions on adding widget descriptions.

Pillar 3: Data Ownership
Every data source and every key metric needs an owner. Not a committee. A single person who is accountable for its accuracy, availability, and documentation.
What Owners Do
- Ensure the data source is accurate and up to date
- Maintain documentation (definitions, known issues, caveats)
- Approve access requests for their data
- Investigate and resolve data quality issues
- Communicate changes that affect downstream consumers
Who Should Own What
The owner should be the person or team closest to the source system:
- CRM data: Sales operations or revenue operations
- Financial data: Finance team
- Product usage data: Product or engineering team
- Marketing data: Marketing operations
- Customer support data: Support operations
- HR data: People operations
Ownership does not mean doing all the work. It means being the accountable point of contact. If someone reports that a revenue number looks wrong, the owner investigates or delegates the investigation.
Pillar 4: Access Controls
Not everyone should see everything. Access controls protect sensitive data and reduce the risk of accidental exposure or misuse.
The Principle of Least Privilege
Give people access to the data they need for their role and nothing more. This is not about trust. It is about reducing risk surface area. An intern accidentally sharing a spreadsheet with salary data is a governance failure, not a trust failure.
Practical Access Tiers
Map your data to sensitivity levels and your people to access tiers:
| Sensitivity Level | Examples | Who Gets Access |
|---|---|---|
| Public | Marketing content, published reports | Everyone |
| Internal | Revenue dashboards, product metrics | All employees |
| Confidential | Customer PII, financial details, HR data | Relevant teams with approval |
| Restricted | Security credentials, legal documents, board materials | Named individuals only |
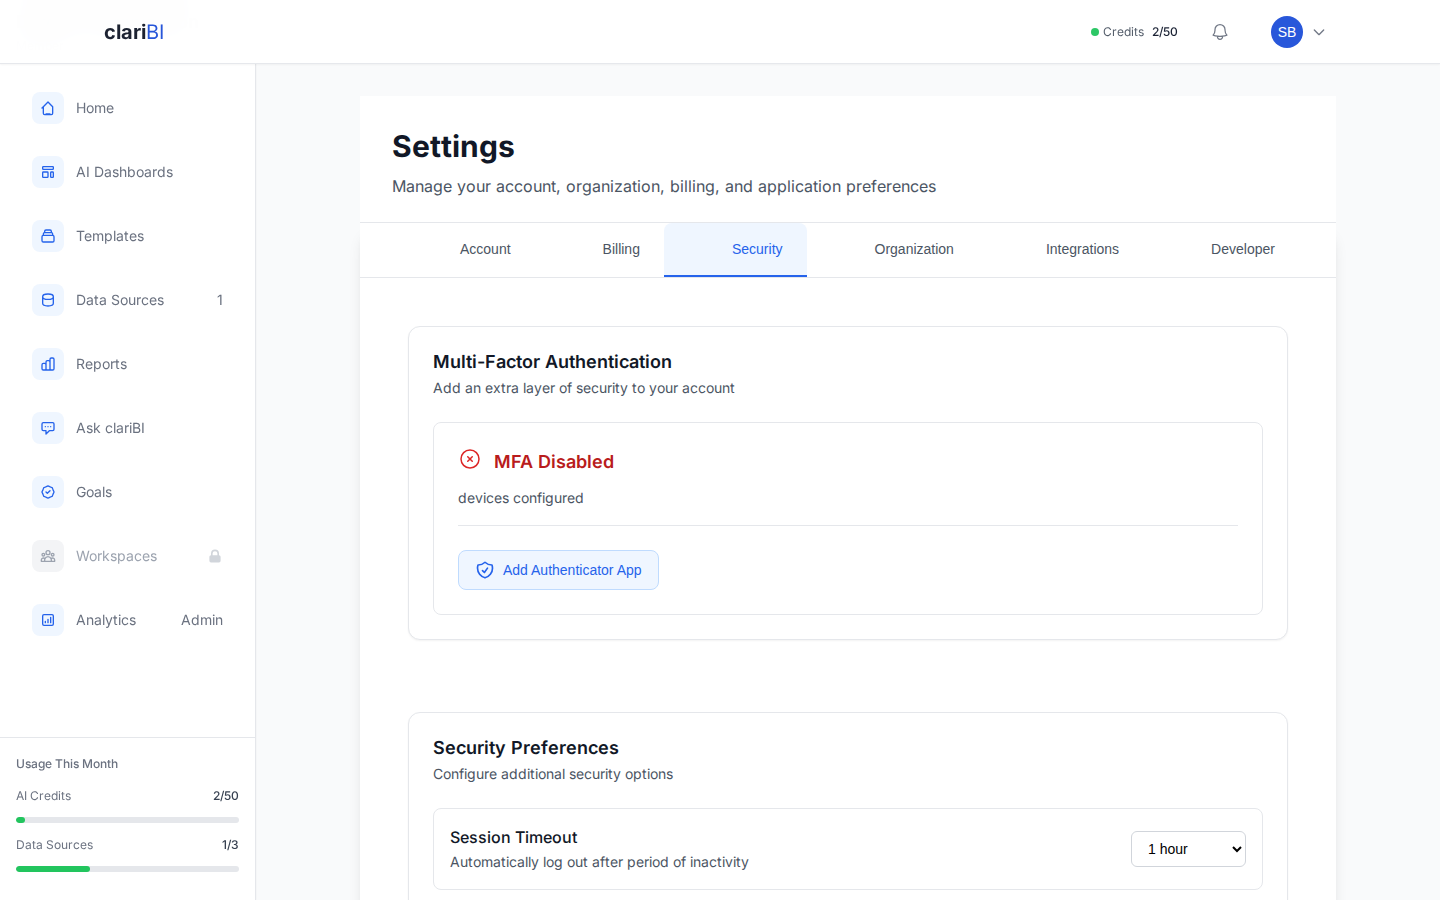
clariBI's role-based access control supports this directly. The five built-in roles (Owner, Administrator, Analyst, Member, Viewer) provide graduated access levels. Custom roles let you fine-tune permissions for specific teams. See the RBAC configuration guide for details on setting up role-based access.
Audit Trails
Access controls are only useful if you can verify they are working. Audit logging tracks who accessed what data, when, and what they did with it. This serves both security (detecting unauthorized access) and compliance (demonstrating control effectiveness during audits).
clariBI logs all user actions including dashboard views, data exports, and configuration changes. Access these logs from Settings > Audit Log or export them for integration with your organization's security monitoring. The audit logging documentation covers log structure, retention, and export options.
Pillar 5: Data Quality
Bad data is worse than no data because people make decisions based on it with false confidence. Data quality governance establishes standards and monitoring to catch problems before they reach dashboards.
The Six Dimensions of Data Quality
- Accuracy: Does the data reflect reality? Are the values correct?
- Completeness: Are required fields populated? What percentage of records are missing key information?
- Consistency: Does the same entity have the same data across systems? Does the customer's email in the CRM match the email in the billing system?
- Timeliness: Is the data current enough for its intended use? A daily dashboard with weekly data is misleading.
- Uniqueness: Are there duplicate records? Duplicate customers inflate counts and distort analysis.
- Validity: Does the data conform to expected formats and ranges? An age of 250 or a negative revenue figure indicates a data entry or integration error.
Automated Quality Monitoring
Manual data quality checks do not scale. Set up automated monitoring that flags anomalies:
- Freshness checks: Alert when a data source has not updated on schedule. If your CRM sync runs nightly and last night's sync failed, you want to know before someone makes decisions based on stale data.
- Volume checks: Alert when the number of records changes unexpectedly. A sudden 50% drop in daily transaction records probably indicates a data pipeline failure, not a business downturn.
- Distribution checks: Alert when metrics move outside historical ranges. If your average order value has been between $40 and $60 for two years and suddenly shows $200, something is likely wrong with the data.
- Schema checks: Alert when data source schemas change. A renamed column or a new null-allowed field can break downstream reports silently.
In clariBI, data source sync status is visible on the data sources management page. Configure notification alerts for sync failures to catch freshness issues immediately. For more sophisticated quality monitoring, use the API to build custom validation checks. Visit the data sources guide for sync configuration details.
Implementation Roadmap
Here is a phased approach that works for companies between 30 and 500 employees:
Phase 1: Foundations (Weeks 1-4)
- Inventory your top 10 data sources
- Define your top 20 business metrics
- Assign data owners for each source and metric
- Review and tighten access controls in all data systems
Phase 2: Operationalize (Weeks 5-12)
- Publish metric definitions where people can find them (wiki, dashboard tooltips, shared document)
- Set up automated freshness and volume monitoring for critical data sources
- Establish a monthly data quality review meeting (30 minutes, data owners attend)
- Enable audit logging across all data platforms
Phase 3: Scale (Ongoing)
- Extend inventory and definitions as you add new data sources and metrics
- Build data quality dashboards that track quality metrics over time
- Incorporate governance requirements into new tool procurement (does it support SSO, RBAC, audit logging?)
- Train new hires on data governance basics during onboarding
Keeping It Lightweight
The biggest risk with data governance is making it too heavy. Enterprise governance frameworks with steering committees, approval workflows for every data access request, and 50-page policy documents will kill momentum at a growing company. Keep these principles in mind:
- Documentation should be living, not locked. A wiki page that anyone can update (with change tracking) is better than a PDF that requires a review cycle to change.
- Processes should be automated where possible. If a human has to remember to check data quality every day, it will not happen. Automate checks and alert on failures.
- Governance should enable, not block. The goal is not to prevent people from accessing data. The goal is to make sure the data they access is accurate, well-defined, and appropriately controlled.
- Start with conventions, not policies. "We define metrics in this template and store them in this wiki" is a convention. "All metric changes must be approved by the Data Governance Committee within 15 business days" is a policy that will be ignored.
Conclusion
Data governance for a growing company is not about building a bureaucracy. It is about answering five questions well: what data do you have, what does it mean, who owns it, who can access it, and how good is it. Start with the data sources and metrics that matter most, assign clear ownership, set up basic quality monitoring, and grow the program as the company grows. The companies that start governance early spend their energy building on a solid foundation. The companies that delay spend their energy cleaning up messes. The best time to start is now, and the best starting point is smaller than you think.