Not every dataset lives in a database. Marketing exports, financial reconciliations, vendor reports, survey results, and one-off analyses often start as CSV files sitting on someone's desktop. clariBI handles these just as well as database connections - upload a file, ask questions, build charts, and share the results. This tutorial walks through the complete process from file upload to finished report.
When to Use CSV Upload vs. Database Connection
Use CSV upload when:
- The data comes from an external source that does not have a direct API connector (vendor reports, third-party data)
- You have a one-off analysis that does not need ongoing automated refresh
- The data is already in a spreadsheet and does not exist in any database
- You want to quickly test whether clariBI is the right tool before setting up a full database connection
Use a database connection when the data updates regularly and you want dashboards to refresh automatically. See the data source connection guide for database setup.
Step 1: Prepare Your CSV File
A few minutes of preparation prevents hours of frustration later:
File Format Requirements
- File type: CSV (comma-separated values) or TSV (tab-separated values)
- Encoding: UTF-8 is recommended. If your file contains special characters (accents, currency symbols), verify the encoding.
- Header row: The first row must contain column names. Avoid spaces and special characters in column names - use
order_daterather thanOrder Date! - Consistent data types: Each column should contain one type of data. A "revenue" column should not mix numbers and text like "$1,500" and "pending."
Common Preparation Steps
- Remove any summary rows at the bottom (totals, averages, notes)
- Ensure dates are in a consistent format (YYYY-MM-DD is the most universally parseable)
- Replace currency symbols and thousand separators so that "$1,500.00" becomes "1500.00"
- Handle blank cells - decide whether blanks mean zero, null, or missing data, and be consistent
- Remove duplicate header rows if the file was exported with repeated headers
Step 2: Upload the File
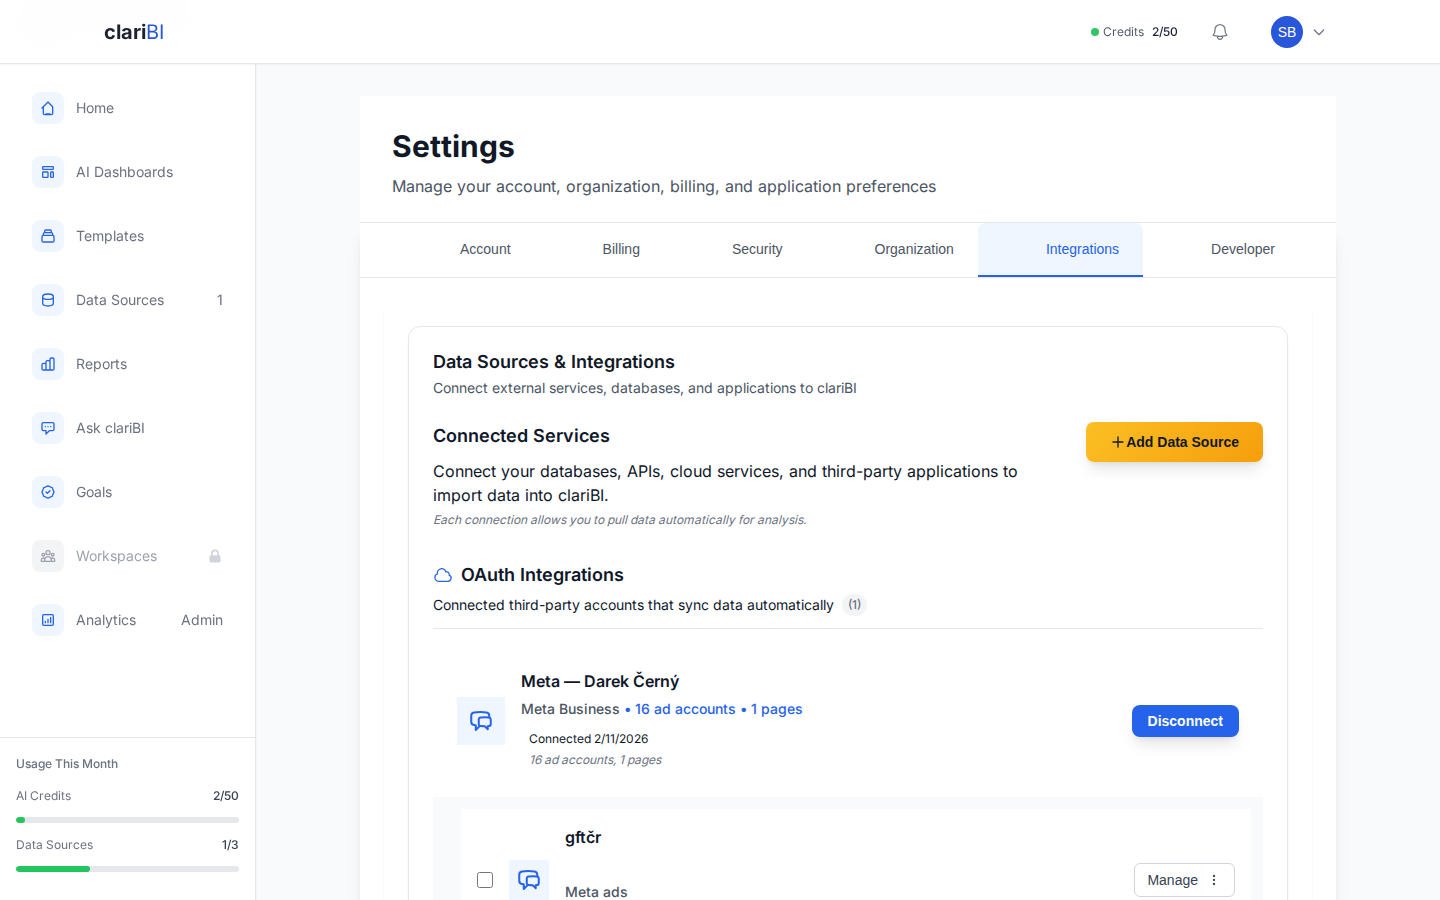
- Navigate to Settings > Data Sources in clariBI
- Click Add Data Source
- Select File Upload
- Choose your CSV file and upload it
- clariBI will display a preview showing detected columns, data types, and the first several rows
- Review the column types - verify that dates are recognized as dates, numbers as numbers, and text as text. Adjust any misdetected types.
- Click Import
The file is now stored as a data source within clariBI. You can query it, visualize it, and include it in dashboards just like any database connection.
Step 3: Explore the Data With Conversational AI
Before building any visualizations, spend a few minutes exploring the data to understand what you are working with. The conversational AI interface is the fastest way to do this:
- "How many rows are in this dataset?" - Verify the record count matches your expectation
- "Show me a summary of each column" - See data types, value ranges, null counts, and unique value counts
- "What are the unique values in the region column?" - Verify categorical data is clean and consistent
- "Show me the date range of the order_date column" - Confirm the time period covered
- "Are there any duplicate rows?" - Catch data quality issues early
This quick exploration catches problems before you build visualizations on top of flawed data. If something looks wrong, fix the source CSV and re-upload rather than trying to work around the issue.
Step 4: Build Visualizations
Now that you understand the data, create the charts that tell your story. For a sales data CSV, typical first visualizations might include:
Revenue Over Time
Ask: "Show me total revenue by month as a line chart." This gives you the trend, which is usually the first thing anyone wants to see. Is revenue growing, flat, or declining?
Revenue by Category
Ask: "Show me revenue broken down by product category as a bar chart." This reveals which categories drive the business and which are underperforming.
Geographic Distribution
Ask: "Show me revenue by region as a horizontal bar chart." Identifies where your customers are concentrated and where growth opportunities exist.
Top Customers
Ask: "Show me the top 10 customers by total revenue as a table." Reveals revenue concentration - if 3 customers represent 40% of revenue, that is a risk worth knowing about.

Step 5: Build a Dashboard
Combine your visualizations into a dashboard that tells a complete story:
- Navigate to Dashboards and click Create Dashboard
- Give it a descriptive title: "Q3 2025 Sales Analysis" is better than "Sales Dashboard"
- Add KPI cards at the top for headline numbers: Total Revenue, Average Order Value, Customer Count
- Add the trend chart (revenue over time) in the middle section
- Add comparison charts (by category, by region) in the lower section
- Add the top customers table at the bottom for detail
Follow the step-by-step dashboard creation guide for detailed layout and configuration options.
Step 6: Create a Shareable Report
A dashboard is great for interactive exploration. A report is better for sharing findings with people who need a clear narrative rather than an exploratory tool.
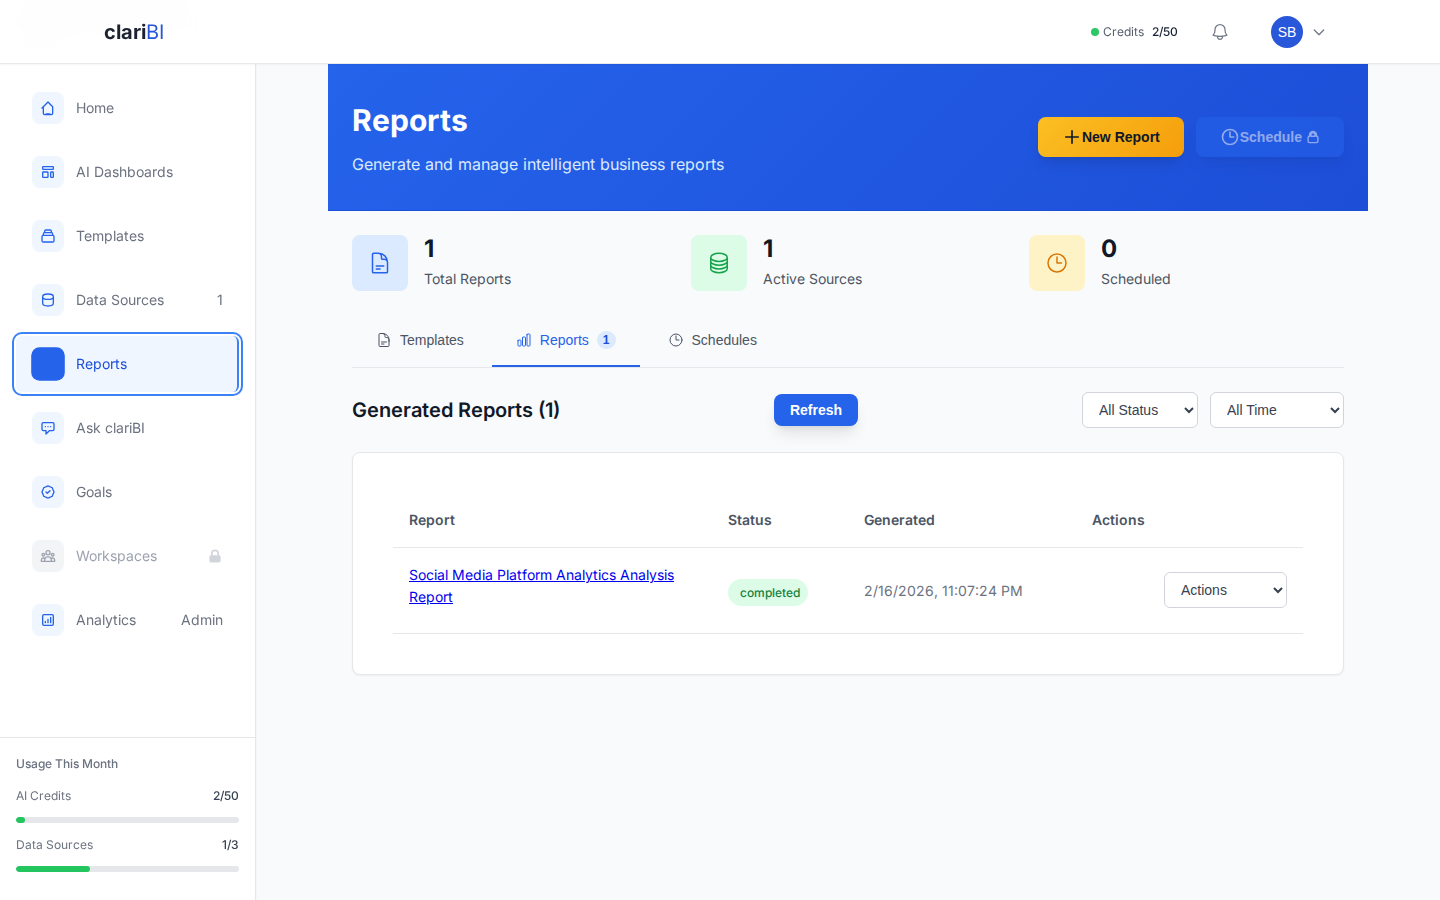
- Navigate to Reports and click Create Report
- Add an executive summary section with the key findings in plain language
- Embed the visualizations from your dashboard
- Add commentary below each chart explaining what the data shows and what it means
- Include a recommendations section with suggested actions based on the data
You can share the report via a link with view-only access, export it as a PDF for email distribution, or schedule it for recurring delivery if the data will be refreshed. See the report creation documentation for all options.
Step 7: Set Up Recurring Updates (Optional)
If this CSV analysis will recur (monthly sales export, weekly vendor report), set up a process for updating the data:
- Replace the uploaded file with the new version - navigate to the data source, click Update, and upload the new file
- Your dashboard and reports will automatically reflect the new data
- For truly automated updates, consider connecting the data source directly to a database or API instead of manually uploading files each time
Tips for Better CSV Analysis
- Clean before you upload. Spending 10 minutes cleaning the CSV saves an hour of troubleshooting later. Remove duplicates, fix formatting, and validate data types in your spreadsheet application first.
- Name columns clearly.
q3_revenue_usdis self-documenting.col_7is not. Clear names make conversational AI queries more natural - you can ask "show me Q3 revenue" instead of trying to remember what column 7 contains. - Include all relevant dimensions. If you want to analyze by region, by product, and by customer segment, make sure those columns are in the file. Adding them later requires re-uploading.
- Keep one concept per file. A single CSV should represent one logical dataset. Combining orders, customers, and inventory into one file creates confusion. Upload them as separate data sources and join them in your analysis if needed.
CSV upload is the fastest path from raw data to insight in clariBI. No database setup, no API configuration - just upload and start asking questions. For data that updates regularly, consider migrating to a database connection for automated refresh, but for one-off analysis, ad-hoc reports, and quick explorations, CSV upload is the ideal starting point.