Most BI tools require you to build queries, configure charts, and understand data models before you can get an answer. clariBI's conversational analytics takes a different approach: type a question in plain English, and the AI translates it into a query, runs it against your data, and returns the answer as text, a chart, or both. This post explains how it works, what kinds of questions it handles well, and where it still falls short.
How Conversational Analytics Works
Behind the scenes, conversational analytics follows a multi-step process:
- Question parsing: The AI reads your natural language question and identifies what you are asking about—which metrics, which time period, which filters, and what kind of comparison
- Schema mapping: It maps the concepts in your question to actual tables and columns in your connected data sources
- Analysis generation: It processes your question through the AI engine, which analyzes the available data and generates insights, charts, and recommendations
- Execution: The query runs against your data and results come back
- Response formatting: The AI decides the best way to present the answer—a single number, a table, a chart, or a narrative explanation—and generates the response
All of this happens in a few seconds. You see a typing indicator while the AI works, then the answer appears in the chat interface.
Getting Started
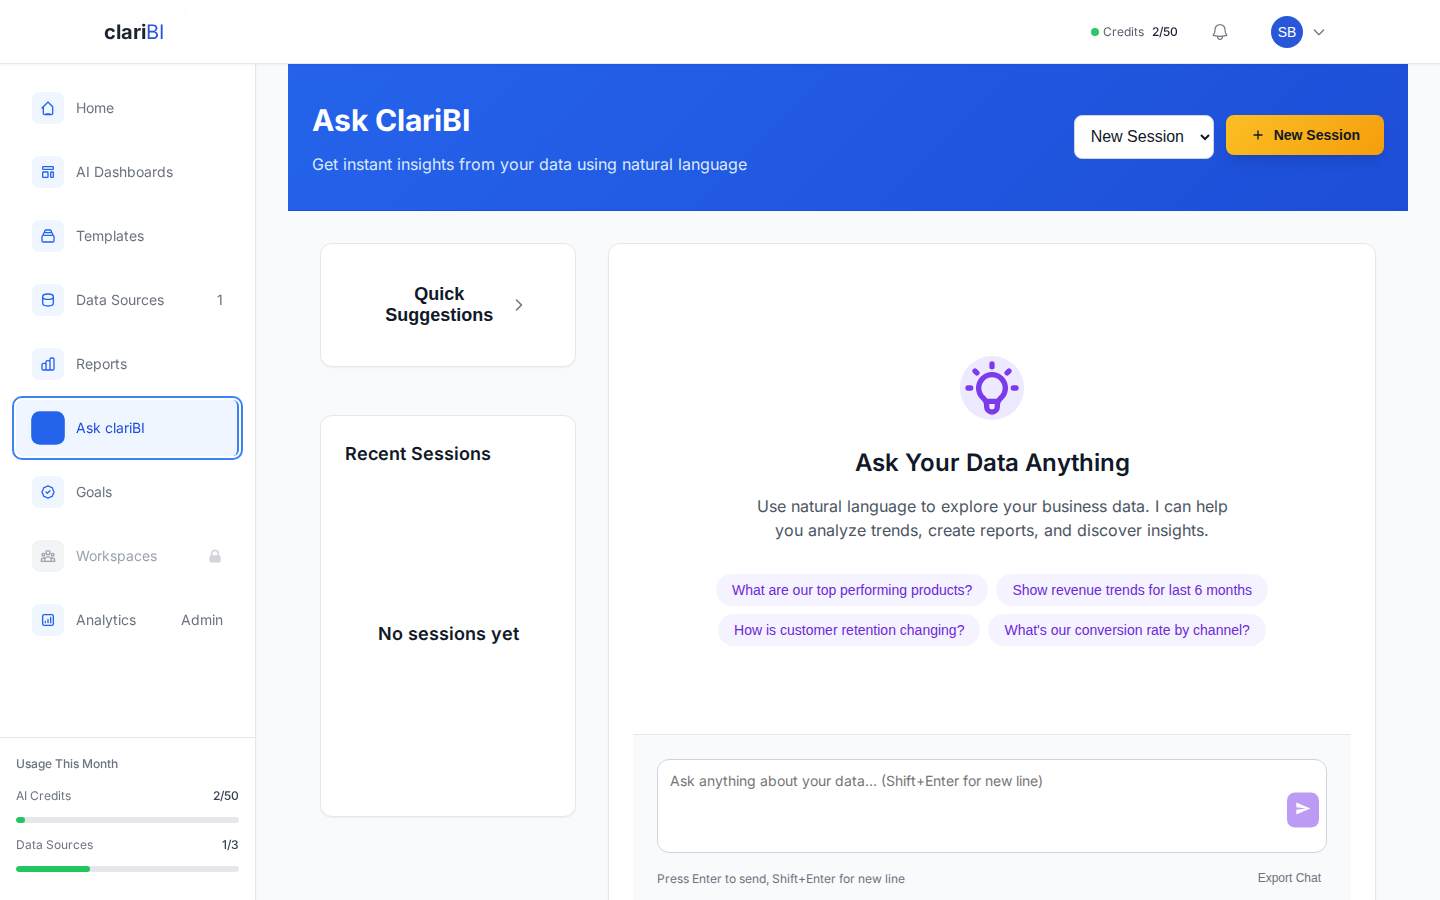
Open conversational analytics from the main sidebar under Analytics or by clicking the chat icon in the top navigation bar. The interface is a simple chat window with a text input at the bottom.
Before you can ask questions, you need at least one connected data source with synced data. The AI can only query data that exists in clariBI. If you have not connected a data source yet, see our Google Analytics connection guide or the general data source guide to get started.
Selecting a Data Source
If you have multiple data sources connected, use the data source selector at the top of the chat to pick which one to query. You can switch data sources mid-conversation. The AI maintains context within a single data source but resets when you switch.
Types of Questions That Work Well
Metric Lookups
Simple questions asking for a specific number:
- "What was total revenue last month?"
- "How many new users signed up this week?"
- "What is the average order value for Q4?"
Trend Analysis
Questions about how a metric changes over time:
- "Show me monthly revenue for the past 12 months"
- "How has our churn rate trended this year?"
- "Plot daily active users over the last 30 days"
Comparisons
Questions that compare groups, periods, or categories:
- "Compare revenue by product category"
- "Which region had the most sales last quarter?"
- "How does this month compare to the same month last year?"
Rankings and Top-N
Questions that ask for the best, worst, or highest:
- "What are our top 10 customers by revenue?"
- "Which marketing channel has the lowest cost per acquisition?"
- "Show me the 5 worst-performing products"
Breakdowns
Questions that split a metric by a dimension:
- "Break down sales by country"
- "Show revenue by sales rep"
- "What is the conversion rate by device type?"
Advanced Features
Follow-Up Questions
The AI remembers context within a conversation. After asking "What was revenue last month?", you can follow up with "Break that down by region" or "How does that compare to the previous month?" without restating the full question. This makes exploration feel natural, like talking through an analysis with a colleague.
Chart Type Suggestions
The AI picks a chart type based on the question. Time series data gets line charts. Category comparisons get bar charts. Proportions get pie or donut charts. If you prefer a different format, just say so: "Show that as a table" or "Can I see that as a horizontal bar chart?"
Saving Results
Any chart or insight generated in a conversation can be saved directly to a dashboard. Click the Add to Dashboard button that appears below each visualization. Select the target dashboard and the widget is added with the same query and configuration.
Exporting
Click the export icon on any result to download it as a PNG image (for charts) or CSV file (for tables). This is useful when you need to include a quick finding in a presentation or email without building a formal report.
Limitations and Honest Caveats
Conversational analytics is powerful but it is not magic. Here is where it struggles:
Ambiguous Questions
If your question can be interpreted multiple ways, the AI may pick the wrong interpretation. "How are we doing?" is too vague. "What is our month-over-month revenue growth rate?" is specific enough to get a good answer. When in doubt, be more specific.
Complex Multi-Step Analysis
Questions that require multiple intermediate calculations or joining data across sources are difficult. "What is the correlation between marketing spend and revenue, controlling for seasonality?" involves several analytical steps that the AI may not chain together correctly. For complex analysis, use the dashboard builder or export data for analysis in a dedicated tool.
Data It Has Not Seen
The AI can only query data that has been synced to clariBI. If your last sync was yesterday, it does not know about today's data. If a metric is not in any connected data source, the AI cannot answer questions about it. It will tell you when it cannot find the data rather than guessing.
Calculation Precision
For financial reporting or compliance purposes, verify important numbers against your source system. The AI generates queries based on its understanding of your schema, and there can be edge cases—null handling, timezone differences, fiscal year boundaries—where its interpretation differs slightly from your official calculations.
Tips for Getting Better Answers
- Be specific about time periods. "Last month" is clearer than "recently." "Q3 2025" is better than "a while ago."
- Name your metrics. Use the same terminology that exists in your data: "MRR" not "recurring money," "sessions" not "visits" (unless your data uses "visits").
- One question at a time. "What was revenue and how many users did we have and what was churn?" is three questions. Ask them separately for clearer answers.
- Use follow-ups for drill-downs. Start broad ("Show me revenue by month") then narrow ("What happened in March?"). The context carries forward.
- Ask for different visualizations. If a line chart is not what you wanted, say "Show that as a bar chart" rather than rephrasing the whole question.
How It Compares to Building Dashboards
Conversational analytics and dashboard building serve different purposes:
| Scenario | Best Tool |
|---|---|
| Quick one-off question | Conversational analytics |
| Recurring metric you check daily | Dashboard widget |
| Exploring data to find patterns | Conversational analytics |
| Executive summary shared with stakeholders | Dashboard or report |
| Ad-hoc analysis during a meeting | Conversational analytics |
The two work well together. Use conversational analytics to explore and find interesting patterns, then save those findings to a dashboard for ongoing monitoring.

What Is Coming Next
We are actively improving conversational analytics. Upcoming additions include multi-source queries (asking a question that spans two data sources at once), suggested follow-up questions after each answer, and the ability to share a conversation thread with a teammate for collaborative analysis. These features are on our near-term roadmap but we do not have exact release dates to share yet.
Getting the Most Out of It
Conversational analytics lowers the barrier to data access significantly. Team members who would never build a dashboard or write a SQL query can now get answers by typing a question. That said, it works best when your data sources are well-configured and your team understands what data is available. Invest time in connecting your key data sources and documenting what metrics mean, and conversational analytics becomes dramatically more useful. For setup help, visit the knowledge base or reach out to our support team.