Google Analytics 4 (GA4) is one of the most common data sources our users connect. This tutorial walks through the entire process from start to finish, including the OAuth authorization flow, selecting the right GA4 property, choosing which metrics to sync, setting a sync schedule, and fixing the connection problems that come up most often.
Before You Start
Make sure you have these things ready:
- A clariBI account on the Starter tier or above (Trial accounts can connect up to 3 data sources)
- Google Analytics 4 access — you need at least Viewer permissions on the GA4 property you want to connect
- The correct GA4 property — if your organization has multiple properties, know which one contains the data you need
A quick note on Universal Analytics: Google sunset UA in July 2024. clariBI only supports GA4 connections. If you still have UA data you need to analyze, export it to BigQuery first, then connect BigQuery as a database source.
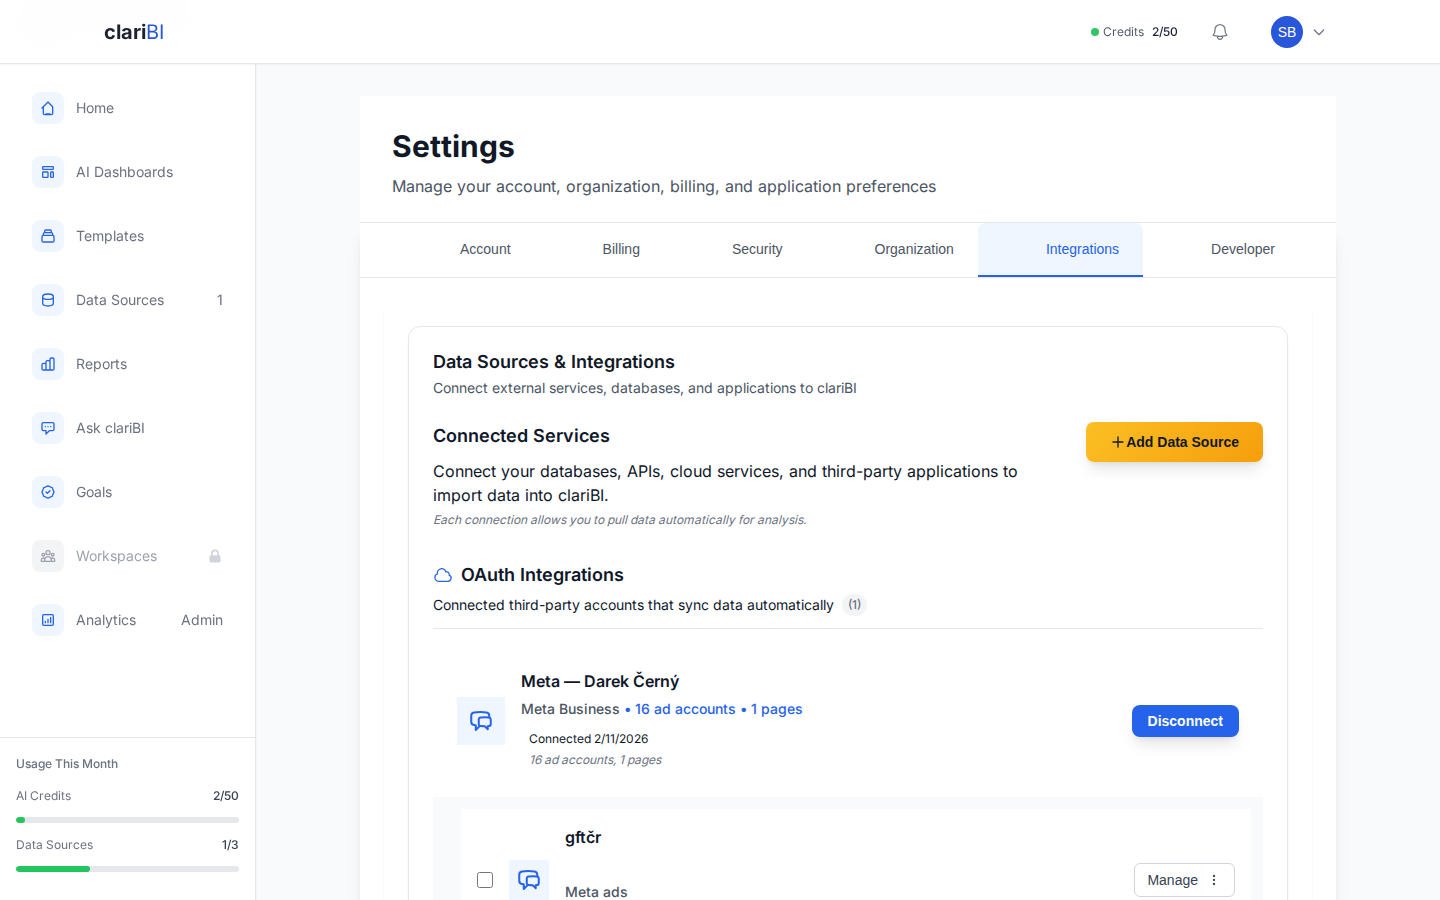
Step 1: Open the Data Sources Panel
Navigate to Settings > Data Sources from the main sidebar, or click + Add Data Source from the data sources widget on your home screen. Either path brings you to the data source management interface.
Step 2: Select Google Analytics
The data source catalog displays available integrations grouped by type: Databases, Cloud Platforms, APIs, and Files. Google Analytics appears under the APIs section. Click the Google Analytics card to begin setup.
You can also use the search bar at the top of the catalog. Type "google" or "analytics" and the list filters instantly.
Step 3: Authorize with Google OAuth
Click Connect with Google. A new browser window opens with the standard Google sign-in flow. Select the Google account that has access to your GA4 property.
Google will ask you to grant clariBI permission to:
- View your Google Analytics data
- View your Google Analytics account configuration
These are read-only permissions. clariBI cannot modify your GA4 configuration, delete data, or access any other Google services beyond Analytics.
Click Allow to complete authorization. The window closes and you are returned to clariBI with a confirmation that the OAuth connection succeeded.
Step 4: Select Your GA4 Property
After authorization, clariBI retrieves the list of GA4 properties available to your Google account. If you manage multiple properties, you will see all of them listed with their property IDs and associated website URLs.
Select the property you want to connect. If you are unsure which property is correct, check the website URL shown next to each option, or open GA4 in another tab and compare property IDs.
One property per connection: Each clariBI data source links to a single GA4 property. If you need data from multiple properties, create a separate data source for each one.
Step 5: Choose Your Metrics and Dimensions
This is the most important configuration step. clariBI presents a list of available GA4 metrics and dimensions organized into groups:
Commonly Selected Metrics
- Traffic: sessions, users, new users, page views, average session duration
- Engagement: engaged sessions, engagement rate, events per session, bounce rate
- Conversions: conversions, conversion rate (if you have GA4 conversion events configured)
- Revenue: total revenue, purchase revenue, average purchase value (for e-commerce properties)
Commonly Selected Dimensions
- Traffic sources: source, medium, campaign, default channel group
- Geography: country, city, region
- Technology: device category, browser, operating system
- Content: page path, page title, landing page
- Time: date, hour, day of week
Select only what you actually need. Pulling every available metric slows down sync times and clutters your data. You can always add more metrics later by editing the data source configuration.

Step 6: Set the Date Range and Sync Schedule
Initial Backfill
Choose how far back to pull historical data. Options range from 30 days to 24 months. Longer backfills give you more historical context for trend analysis but take longer to complete. For most users, 6 months is a good starting point.
Sync Frequency
Set how often clariBI should refresh the data:
- Every hour — best for real-time monitoring dashboards
- Every 6 hours — good balance of freshness and API quota usage
- Daily — sufficient for most reporting needs, uses the least API quota
- Manual — sync only when you trigger it manually
Keep in mind that GA4 has API quotas. If your organization hits quota limits, reduce the sync frequency or narrow the metrics you pull.
Step 7: Test and Save
Click Test Connection. clariBI runs a small sample query against your GA4 property to verify that authorization works and the selected metrics return data. If the test passes, you will see a green success message with a preview of the first few rows.
Click Save to finalize. The initial data sync begins immediately in the background. You will receive a notification when it completes. For a 6-month backfill with typical metrics, expect the first sync to take 2-5 minutes.

Using GA4 Data in Dashboards
Once the sync completes, your GA4 data is available everywhere in clariBI:
- Dashboard widgets: select the GA4 data source when creating or editing any widget
- Conversational analytics: ask questions like "What were my top traffic sources last month?"
- Reports: include GA4 metrics in scheduled reports
- Templates: deploy marketing-focused templates and map them to your GA4 data source
For a marketing overview dashboard, try the "Marketing Performance Overview" template from the marketplace and map it to your GA4 data source. It includes widgets for traffic trends, source breakdown, top pages, and conversion tracking.
Troubleshooting Common Issues
"Authorization Failed" or "Token Expired"
Google OAuth tokens expire periodically. Go to Settings > Data Sources, find your GA4 connection, and click Reauthorize. This opens the Google sign-in flow again. After re-authorizing, syncs resume automatically.
"No Properties Found"
This means the Google account you authorized does not have access to any GA4 properties. Double-check that you signed in with the correct Google account. If you use multiple Google accounts, sign out of all of them in your browser first, then retry the OAuth flow so you can pick the right one.
"Quota Exceeded"
GA4 has daily API request limits. If you hit them, reduce your sync frequency to daily or narrow the date range and metric set. clariBI automatically retries failed syncs, so data will catch up once quota resets (midnight Pacific Time).
"Sampling Applied" Warning
GA4 applies data sampling when queries exceed certain thresholds. If you see this warning, it means your results are approximations. To get unsampled data, narrow the date range or reduce the number of dimensions. Alternatively, connect BigQuery-exported GA4 data for full-fidelity access.
Data Discrepancies
Minor differences between clariBI and the GA4 interface are normal. GA4 applies filters, attribution models, and thresholding that may not be reflected identically in API responses. For exact parity, compare using the same date range, segments, and attribution model in both tools.
Next Steps
With Google Analytics connected, consider these follow-up actions:
- Build a marketing dashboard using the Marketing Performance template
- Set up a scheduled report to email weekly traffic summaries to your team
- Combine with other sources — connect your CRM or ad platform to build multi-source dashboards that show the full customer journey
- Create goals in clariBI tied to GA4 metrics like sessions or conversion rate
For detailed instructions on connecting other data sources, visit the data source connection overview or browse the knowledge base.