The quality of answers you get from AI analytics depends heavily on the quality of your questions. A vague question produces a vague answer. A specific question produces a useful one. This tutorial provides 40 real-world examples organized by business function, showing how to move from imprecise questions to ones that get you actionable data. Each example includes the weak version, the improved version, and an explanation of why the improvement matters.
Why Question Quality Matters
When you ask an AI analytics system a question, it needs to determine four things:
- What metric you want (revenue, users, conversion rate, etc.)
- What dimensions to group by (product, region, time period, customer segment)
- What filters to apply (date range, specific categories, status conditions)
- What comparison or context to provide (vs. last period, vs. target, ranking)
Vague questions leave one or more of these undefined, forcing the AI to guess. Sometimes it guesses right. Often it does not. Specific questions define all four elements, leaving little room for misinterpretation.

Sales and Revenue (10 Examples)
Example 1: Total Revenue
Weak: "How are sales?"
Better: "What was total revenue for completed orders in Q4 2025, compared to Q4 2024?"
Why: The improved version specifies the metric (revenue), the filter (completed orders), the time period (Q4 2025), and the comparison (vs. Q4 2024). The weak version could return anything from today's orders to a five-year trend.
Example 2: Pipeline Health
Weak: "Show me the pipeline."
Better: "Show the current sales pipeline broken down by deal stage, with total value and deal count per stage, for deals with expected close date in Q1 2026."
Why: Specifies what "pipeline" means (deals by stage), the measures (value and count), and a time boundary.
Example 3: Sales Rep Performance
Weak: "Who is our best salesperson?"
Better: "Rank sales reps by closed-won revenue in the last 90 days. Include their deal count and average deal size."
Why: "Best" is subjective. The improved version defines the ranking criterion and adds context metrics.
Example 4: Win Rate
Weak: "What is our win rate?"
Better: "What percentage of deals that entered the proposal stage in the last 6 months were marked as closed-won? Show this by month."
Why: Win rate depends on the denominator. All leads? All qualified opportunities? All proposals? The improved version defines the stage and time window.
Example 5: Revenue by Product
Weak: "Which products are doing well?"
Better: "Show revenue by product category for the last 12 months with month-over-month growth rates. Highlight any category with declining revenue for 3 or more consecutive months."
Why: "Doing well" needs a definition. Revenue? Growth? Margin? The improved version asks for specific measures and a specific pattern to watch for.
Example 6: Deal Velocity
Weak: "How fast are we closing deals?"
Better: "What is the average number of days from opportunity creation to closed-won for deals closed in the last 6 months, broken down by deal size tier (under $10K, $10K-$50K, over $50K)?"
Example 7: Quota Attainment
Weak: "Are we hitting our numbers?"
Better: "Show each sales rep's revenue this quarter versus their quota target. Calculate the percentage attainment and sort by gap to target."
Example 8: New vs. Expansion Revenue
Weak: "Where is revenue coming from?"
Better: "Break down this quarter's revenue into new customer revenue, expansion revenue from existing customers, and renewal revenue. Compare the same breakdown to last quarter."
Example 9: Lost Deals
Weak: "Why are we losing deals?"
Better: "For deals marked as closed-lost in the last 90 days, show the distribution of loss reasons. Include the average deal size for each reason category."
Why: "Why" questions are hard for AI. The improved version asks for data that helps a human determine why.
Example 10: Forecast Accuracy
Weak: "Is our forecast accurate?"
Better: "Compare the forecasted revenue from 90 days ago with actual closed revenue for the same period. Show this for each of the last 4 quarters."
Marketing (10 Examples)
Example 11: Channel Performance
Weak: "How is marketing doing?"
Better: "Show leads generated by marketing channel for the last 3 months. Include cost per lead and lead-to-opportunity conversion rate for each channel."
Example 12: Campaign ROI
Weak: "Was the campaign worth it?"
Better: "For the Q4 holiday campaign, show total spend, leads generated, opportunities created, and revenue attributed. Calculate the cost per lead and ROI."
Example 13: Website Performance
Weak: "How is the website doing?"
Better: "Show weekly website sessions, unique visitors, and signup conversion rate for the last 8 weeks. Flag any week where conversion rate dropped more than 20% from the prior week."
Example 14: Content Performance
Weak: "Which content is popular?"
Better: "Rank blog posts published in the last 6 months by total page views. Include average time on page and the number of lead form submissions attributed to each post."
Example 15: Email Metrics
Weak: "How are our emails performing?"
Better: "Show open rate, click rate, and unsubscribe rate for each email campaign sent in the last 60 days. Compare to our 12-month average for each metric."
Example 16: Lead Quality
Weak: "Are we getting good leads?"
Better: "Of leads created in Q4 2025, what percentage converted to qualified opportunities within 30 days? Break this down by lead source."
Example 17: Ad Spend Efficiency
Weak: "Are we spending too much on ads?"
Better: "Show monthly Google Ads and LinkedIn Ads spend alongside the number of demo requests from each channel. Calculate the cost per demo request by channel and month."
Example 18: SEO Progress
Weak: "How is our SEO?"
Better: "Show organic search traffic by month for the last 12 months. Include the number of landing pages receiving at least 100 organic visits per month."
Example 19: Customer Acquisition Cost
Weak: "What does it cost to get a customer?"
Better: "Calculate total marketing and sales spend divided by new customers acquired, by quarter, for the last 4 quarters. Break out the marketing component and sales component separately."
Example 20: Funnel Analysis
Weak: "Show me the funnel."
Better: "Show the conversion rate between each stage of our marketing funnel (visitor to lead, lead to MQL, MQL to SQL, SQL to opportunity, opportunity to customer) for the last 6 months. Highlight the stage with the largest drop-off."
Customer Success (10 Examples)
Example 21: Churn Analysis
Weak: "How is churn?"
Better: "What is our monthly customer churn rate for the last 12 months? Also show revenue churn rate. Break down churned customers by plan tier."
Example 22: Customer Health
Weak: "Which customers are at risk?"
Better: "List customers with a login count in the last 30 days that is less than 25% of their average monthly login count over the prior 6 months. Include their plan tier and monthly revenue."
Example 23: NPS Trends
Weak: "What do customers think of us?"
Better: "Show our NPS score by month for the last 12 months, segmented by customer tenure (under 6 months, 6-12 months, over 12 months)."
Example 24: Support Volume
Weak: "How is support doing?"
Better: "Show weekly support ticket volume, average first response time, and average resolution time for the last 3 months. Break down by ticket priority."
Example 25: Feature Adoption
Weak: "Are people using the new feature?"
Better: "What percentage of active users used [feature name] at least once in the last 30 days? Show this as a weekly trend since the feature launched. Compare adoption rates for enterprise vs. starter plan customers."
Example 26: Onboarding Completion
Weak: "How is onboarding going?"
Better: "Of customers who signed up in the last 90 days, what percentage completed all onboarding steps within their first 14 days? Show completion rate by step to identify where users drop off."
Example 27: Expansion Revenue
Weak: "Are customers upgrading?"
Better: "How many customers upgraded their plan tier in the last quarter? Show the total incremental monthly revenue from upgrades, grouped by the tier they upgraded from and to."
Example 28: Retention Cohorts
Weak: "Are we retaining customers?"
Better: "Show a retention cohort chart: for each monthly signup cohort in 2025, what percentage of customers were still active at 30, 60, 90, 180, and 365 days?"
Example 29: Customer Feedback Themes
Weak: "What are customers complaining about?"
Better: "Show the distribution of support ticket categories for the last 60 days, sorted by volume. For the top 3 categories, show whether volume is increasing or decreasing week over week."
Example 30: Account Engagement
Weak: "Are enterprise accounts engaged?"
Better: "For enterprise-tier accounts, show the number of active users as a percentage of licensed seats, average dashboard views per user per week, and the last login date for the account admin. Flag accounts where less than 30% of seats are active."
Finance and Operations (10 Examples)
Example 31: Cash Flow
Weak: "How is our cash flow?"
Better: "Show monthly cash inflows and outflows for the last 6 months. Include the ending cash balance each month and the month-over-month change in net cash position."
Example 32: Expense Tracking
Weak: "Are we overspending?"
Better: "Show actual expenses versus budget by department for this quarter. Calculate the variance percentage and flag any department that is more than 10% over budget."
Example 33: Revenue Recognition
Weak: "What is our revenue?"
Better: "Show recognized revenue by month for the last 12 months alongside deferred revenue balance at month end. Include the ratio of deferred to recognized revenue."
Example 34: Gross Margin
Weak: "What are our margins?"
Better: "Calculate gross margin percentage by product line for each of the last 4 quarters. Highlight any product line where gross margin declined by more than 3 percentage points quarter over quarter."
Example 35: Headcount and Efficiency
Weak: "Are we efficient?"
Better: "Show revenue per employee by department for the last 4 quarters. Include the headcount trend alongside the revenue trend for each department."
Example 36: Accounts Receivable
Weak: "How are collections going?"
Better: "Show the accounts receivable aging breakdown: current, 30 days, 60 days, 90+ days. Compare this month's aging distribution to the same month last year."
Example 37: Vendor Spend
Weak: "Where is our money going?"
Better: "List our top 20 vendors by total spend in the last 12 months. Include the year-over-year change in spend and the number of invoices for each vendor."
Example 38: Burn Rate
Weak: "How long will our money last?"
Better: "Calculate our average monthly net burn rate over the last 6 months. Divide current cash balance by that burn rate to estimate months of runway. Show the trend in monthly burn rate."
Example 39: Unit Economics
Weak: "Are we making money on each customer?"
Better: "Calculate average customer lifetime value and average customer acquisition cost for each quarterly cohort in 2025. Show the LTV:CAC ratio and the months to payback for each cohort."
Example 40: Operational SLAs
Weak: "Are we meeting our SLAs?"
Better: "Show the percentage of support tickets resolved within the SLA target for each priority level, by week, for the last 8 weeks. Include the average resolution time and the 95th percentile resolution time for each priority."
Patterns for Better Questions
Looking across all 40 examples, several patterns emerge:
Pattern 1: Specify the Metric
Name the exact metric you want. "Revenue" is better than "sales." "Closed-won revenue" is better than "revenue." "Closed-won revenue from new customers" is better still.
Pattern 2: Define the Time Period
Always include a time range. "Last quarter" and "the last 90 days" are both fine. "Recently" is not.
Pattern 3: Include a Comparison
Numbers alone are hard to interpret. Add a comparison: vs. last period, vs. target, vs. a benchmark. This gives the AI context for whether the number is good or bad.
Pattern 4: Specify the Breakdown
Tell the AI how to slice the data: by product, by region, by customer segment, by time period. Without this, you get a single number instead of a useful breakdown.
Pattern 5: Ask for What You Need, Not How You Feel
Replace emotional framing with analytical framing. Instead of "Why is churn bad?" ask "Show churn rate by cohort, plan tier, and cancellation reason for the last 6 months."
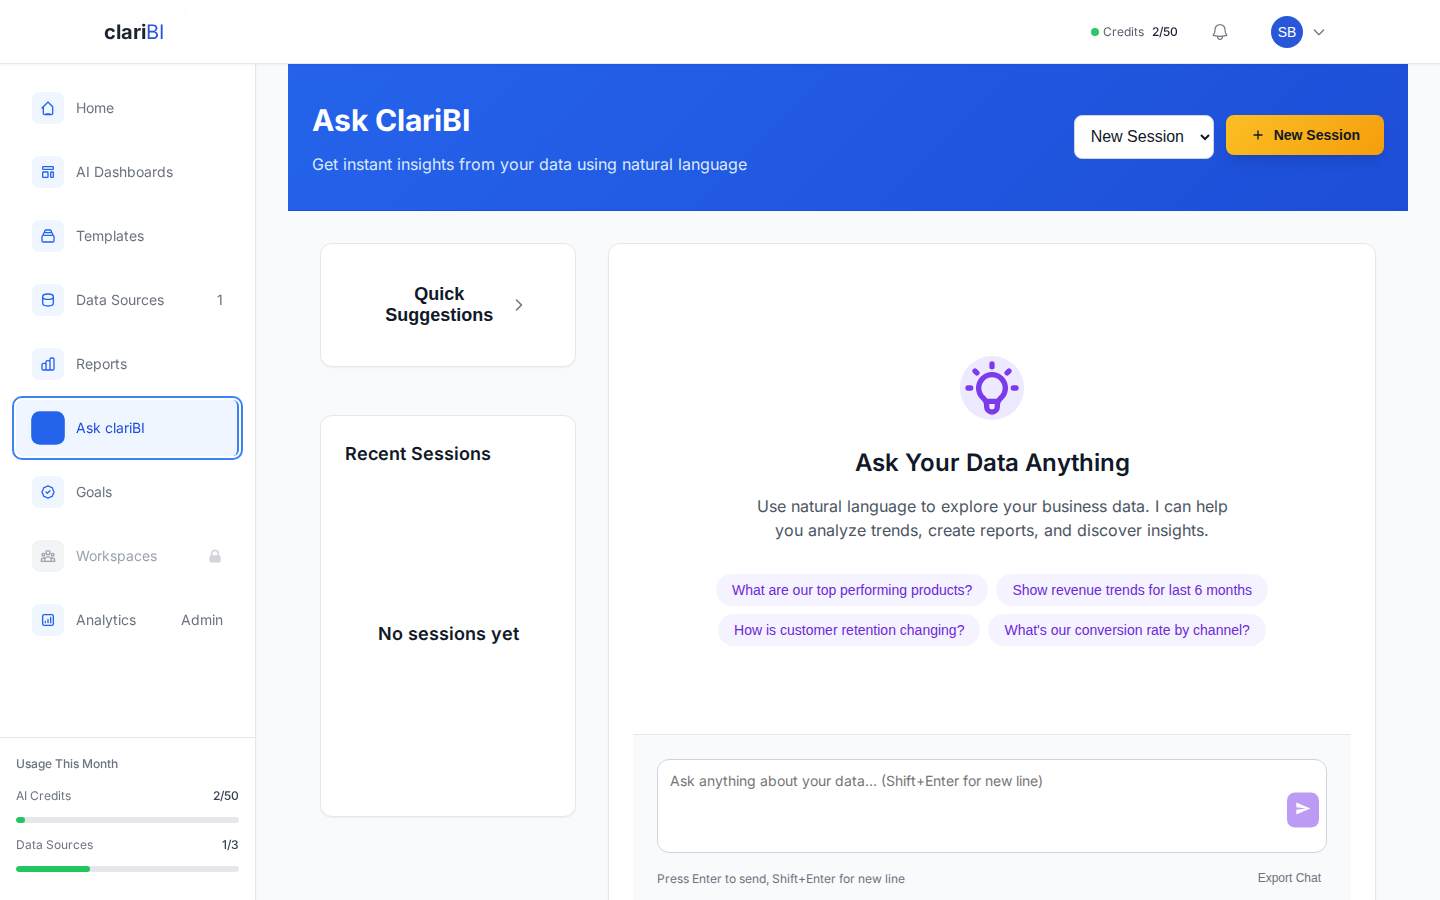
How clariBI Helps You Ask Better Questions
- Suggested Questions: clariBI suggests relevant follow-up questions based on your data and current analysis, helping you explore dimensions you might not have considered.
- Question Templates: Pre-built question templates for common business analyses. Select a template, customize the parameters, and get results immediately.
- Conversation History: Build on previous questions. Start broad, then refine. "Show me revenue by month" followed by "break that down by product line" followed by "just show the top 5."
- Transparent Queries: See the underlying query to verify that the AI interpreted your question correctly. If it did not, you know exactly what to adjust.
Conclusion
Getting value from AI analytics is a skill, and like any skill, it improves with practice. Start with the patterns above: name the metric, specify the time period, include a comparison, define the breakdown. As you see how the AI interprets your questions, you will develop an intuition for how to phrase requests that get accurate, useful results on the first try. The forty examples in this article are a reference you can return to whenever you need inspiration for how to frame a business question for an AI analytics tool.