AI can now produce business reports that would have taken an analyst hours to compile. Summary statistics, trend descriptions, chart recommendations, even written narratives about what the data shows. But handing an AI-generated report directly to a stakeholder without review is a mistake. Some parts of these reports are consistently reliable. Others need a careful human eye. Knowing the difference is what separates useful automation from dangerous automation.
What AI Reports Typically Include
A modern AI-generated business report usually contains several components:
- Summary statistics: Totals, averages, percentages, period-over-period changes
- Trend descriptions: Narrative text describing whether metrics are up, down, or flat
- Visualizations: Charts chosen by the AI to represent the data
- Comparisons: Performance against targets, benchmarks, or prior periods
- Highlights and lowlights: Notable outliers, best performers, and areas of concern
- Recommendations: Suggested actions based on the data
What AI Gets Right (Usually)
1. Arithmetic and Aggregation
AI is reliable at basic math. Sums, averages, counts, percentages, and period-over-period calculations are almost always correct, provided the underlying data is clean. If the data says total revenue was $1,234,567, the AI will report $1,234,567. It will not make a rounding error or misplace a decimal.
This sounds obvious, but it represents real value. Manually compiling these numbers from multiple data sources is tedious and error-prone. Automating the arithmetic frees analysts to focus on interpretation.
2. Pattern Recognition
AI is good at identifying patterns in data: upward trends, seasonal peaks, correlations between metrics, outlier values. It can scan thousands of data points and surface the most notable patterns far faster than a human can.
Pattern recognition is where AI adds the most value in reporting. An analyst might focus on the three metrics they expected to check. AI examines everything and flags patterns the analyst might have missed.
3. Chart Selection
Given structured data, AI is reasonably good at choosing appropriate visualization types. Time series data gets line charts. Categorical comparisons get bar charts. Part-to-whole relationships get pie charts (ideally with five or fewer categories). This is not always perfect, but it is right often enough to be useful as a starting point.
4. Consistent Formatting
AI-generated reports follow consistent formatting rules. Every report uses the same structure, the same chart styles, the same narrative format. This consistency is valuable for stakeholders who review reports regularly. They know where to look for what.
What AI Gets Wrong (Often Enough to Matter)
1. Causal Claims
This is the single biggest risk in AI-generated reports. AI sees correlation and often presents it as causation, either explicitly or through implication:
- "Revenue increased because the new marketing campaign launched." (Maybe. Or maybe it was seasonal. Or maybe a large deal closed independently.)
- "Customer churn decreased following the product update." (Did the update cause the decrease, or is this normal monthly variation?)
- "Sales in the West region outperformed due to the new pricing strategy." (Were other factors at play? A new sales hire? A competitor exit?)
AI reports frequently connect events that happened around the same time and present one as causing the other. This is the section that most needs human review. A human analyst brings institutional knowledge about what actually happened in the business.
2. Missing Context
AI does not know what it does not know. It works with the data it has and cannot account for:
- A key competitor that launched a new product last week
- A major customer that warned you they are evaluating alternatives
- Internal reorganizations that shifted budget between departments
- Data collection changes that make period comparisons misleading
- Pending deals that will close next week but are not in the data yet
These contextual factors can completely change the interpretation of data. The AI will report the numbers accurately but miss the story behind them.
3. Significance vs. Noise
AI sometimes highlights statistically insignificant changes as meaningful findings. A 2% week-over-week fluctuation in a metric that normally varies by 5% is not a finding. It is noise. But the AI might report it as a "decline worth monitoring."
Human review should ask: Is this change larger than normal variation? Is the sample size large enough to draw conclusions? Would we have noticed this if we were not specifically looking for things to report?
4. Metric Definition Assumptions
When an AI report says "active users increased 12%," what definition of "active" did it use? Logged in at least once? Performed a key action? Active for more than five minutes?
AI systems use whatever metric definition is embedded in the data or semantic layer. If the definition changed, if it does not match what stakeholders expect, or if multiple valid definitions exist, the report may be technically correct but practically misleading.
5. Recommendations and Predictions
The weakest part of most AI-generated reports is the recommendations section. Recommendations require understanding business constraints, priorities, resources, competitive dynamics, and organizational politics. None of these live in the data.
An AI might recommend "increase marketing spend in the West region based on strong performance," but it does not know that the West region sales rep is leaving next month, or that the marketing budget is already committed to a product launch.
A Practical Review Checklist
Before sharing any AI-generated report with stakeholders, review these areas:
Trust (Usually No Review Needed)
- Totals, sums, averages, counts
- Period-over-period percentage changes
- Rankings (top/bottom performers)
- Data visualization choices
- Formatting and structure
Verify (Quick Review)
- Metric definitions match what stakeholders expect
- Time periods are correct (watch for off-by-one errors in date ranges)
- Comparisons use appropriate baselines (same period last year, not just last month)
- Highlighted changes are statistically meaningful, not just noise
Rewrite or Remove (Careful Review)
- Any causal claims ("X happened because of Y")
- Forward-looking predictions without clear methodology
- Recommendations for action
- Narrative explanations of why metrics changed
- Conclusions that require business context the AI does not have
Building an Effective AI + Human Workflow
Step 1: AI Generates the Draft
Let AI handle data compilation, basic analysis, chart generation, and initial narrative. This saves 60-80% of the time an analyst would spend on these tasks.
Step 2: Human Reviews and Edits
The analyst adds context, corrects causal claims, removes noise, and validates that metrics match expectations. This takes 20-30 minutes for a report that would have taken 3-4 hours to create from scratch.
Step 3: Human Writes Recommendations
Keep the recommendations section human-authored. This is where business judgment, institutional knowledge, and strategic thinking matter most.
Step 4: Stakeholder Receives Final Report
The result is a report that combines AI speed and thoroughness with human judgment and context. It is faster than a purely human process and more reliable than a purely AI process.
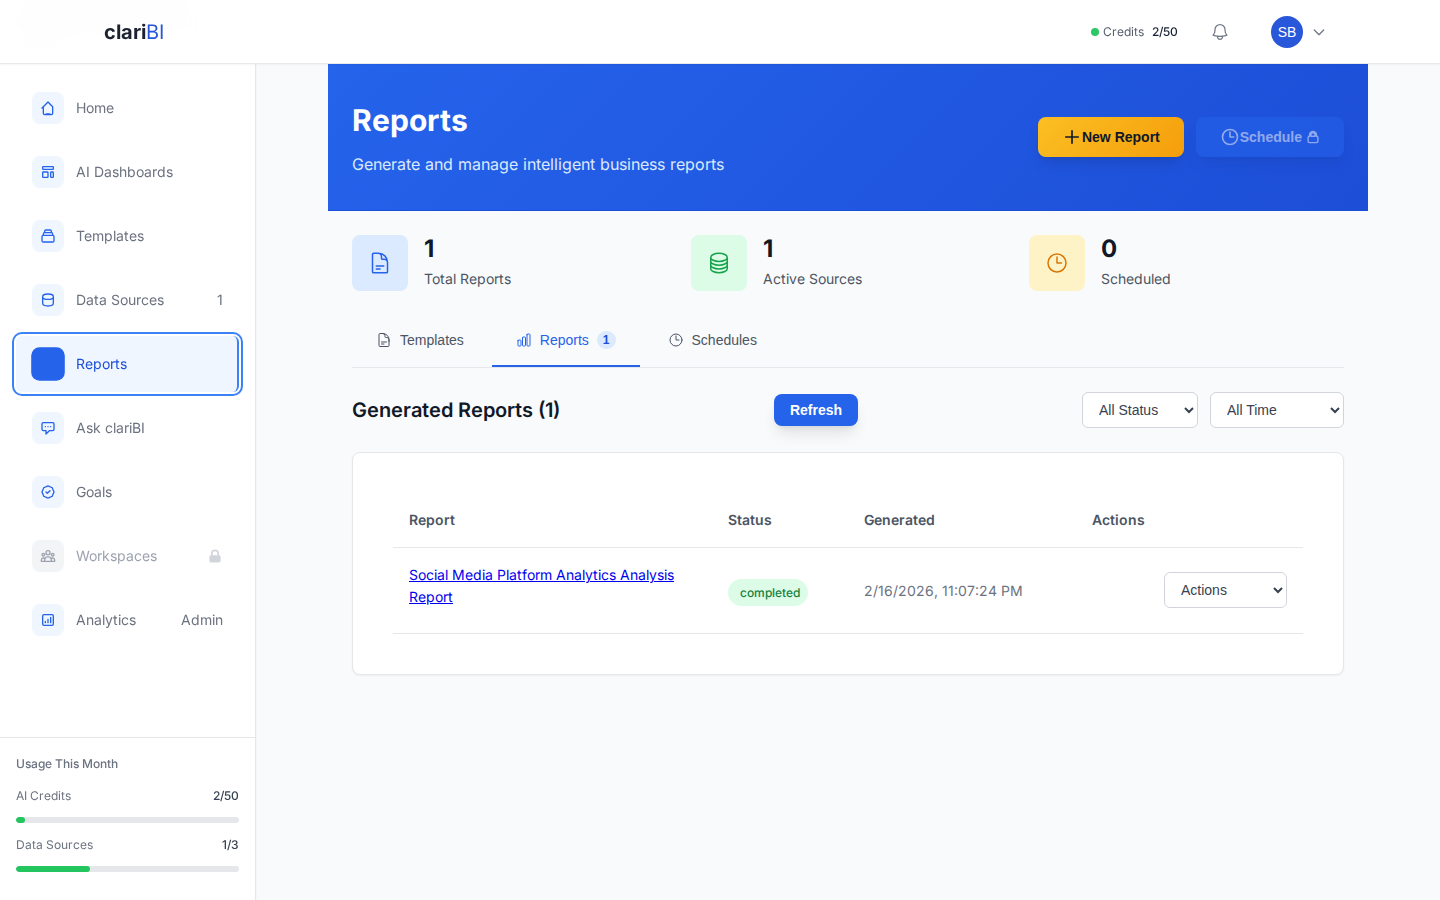
How clariBI Handles AI Reports
clariBI's report generation features are designed for this hybrid workflow:
- AI Draft Generation: Generate complete report drafts from your data with one click or a natural language request.
- Editable Narratives: AI-generated text can be edited before sharing, so you can add context and correct any misinterpretations.
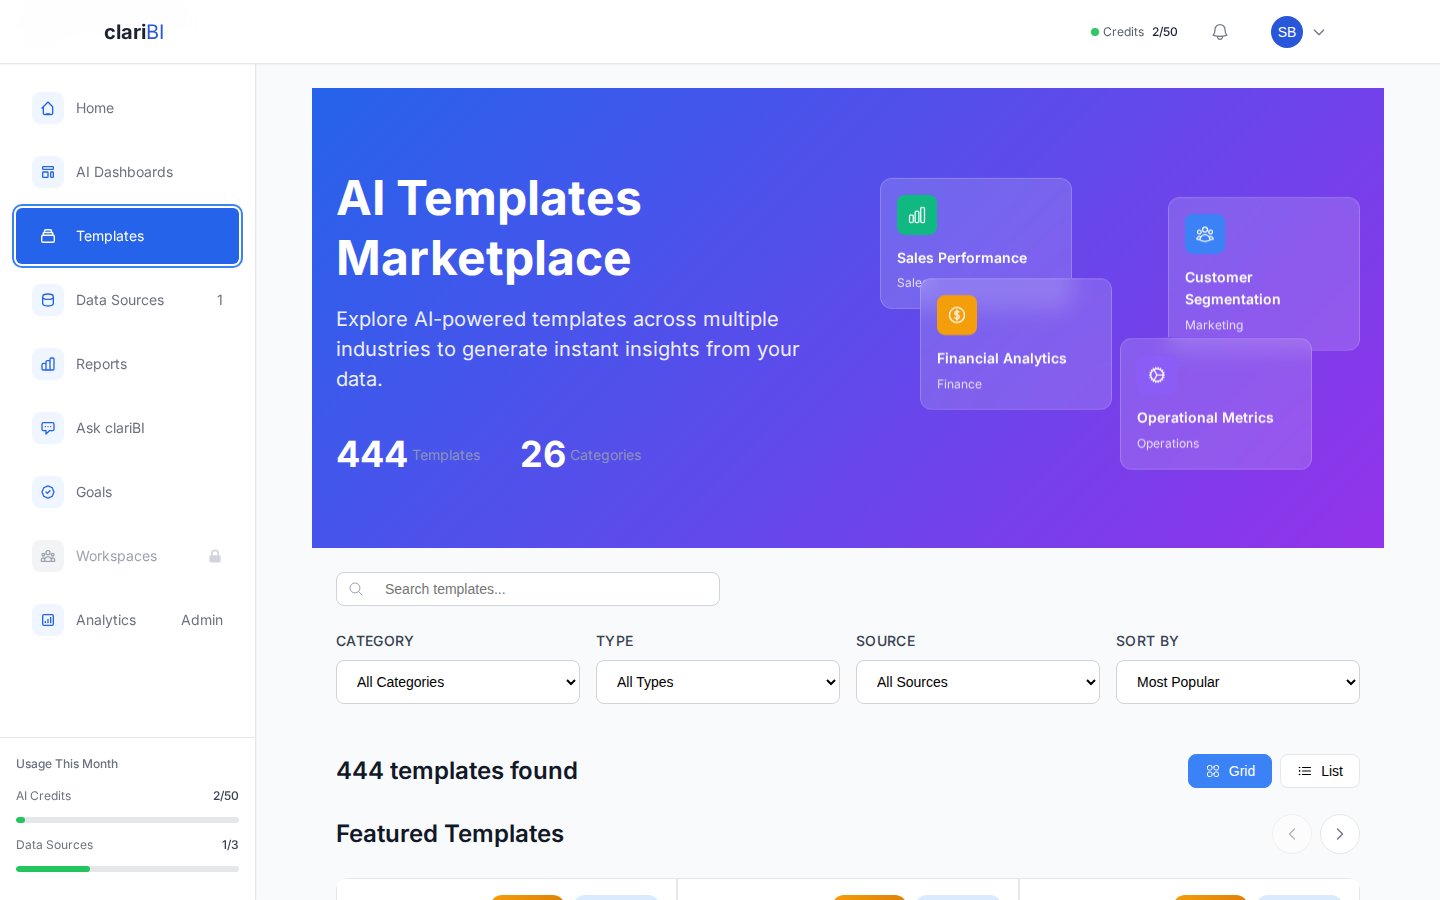
- Template System: Pre-built report templates ensure consistent structure while allowing customization of the narrative sections.
- Transparent Calculations: Every number in a clariBI report links back to the underlying data and calculation method, making verification straightforward.
- Scheduled Reports: Set up recurring reports that generate automatically but route through a review step before distribution.
Conclusion
AI-generated reports are a productivity multiplier, not a replacement for analytical judgment. Trust the math. Verify the definitions and significance. Rewrite the causal claims and recommendations. This hybrid approach gives you the speed of AI with the reliability of human oversight. As AI models improve, the "verify" and "rewrite" lists will shrink, but for now, the human review step is what separates a useful report from a misleading one.