At 50 people, your company is past the spreadsheet stage but not yet at the point where you can justify a six-figure BI platform with a dedicated analytics engineering team. You need something that works without a full-time administrator, connects to the data you already have, and delivers value before your next board meeting. Here is how to evaluate BI tools at this stage without wasting months on the wrong choice.
Why 50 People Is the Inflection Point
Companies with 10-20 people usually survive on spreadsheets, Notion databases, and the occasional SQL query from a technical co-founder. It is messy but manageable because everyone can see everything and the data volume is small.
At 50 people, several things break simultaneously:
- Data silos form. Sales uses one CRM, Marketing uses another platform, Finance has their own spreadsheets. Nobody has a unified view.
- The founder bottleneck appears. The CEO or CTO who used to pull every report is now too busy. Questions go unanswered for days.
- Consistency disappears. Three people calculate the same metric three different ways. Meetings devolve into debating whose spreadsheet is right.
- Decisions slow down. Without accessible data, decisions that should take a day take a week because someone has to manually compile information.
This is the moment when a BI tool goes from "nice to have" to "necessary." But choosing the wrong tool wastes money and - worse - erodes trust in data-driven decision making before it starts.
The Evaluation Criteria That Actually Matter
1. Time to First Dashboard
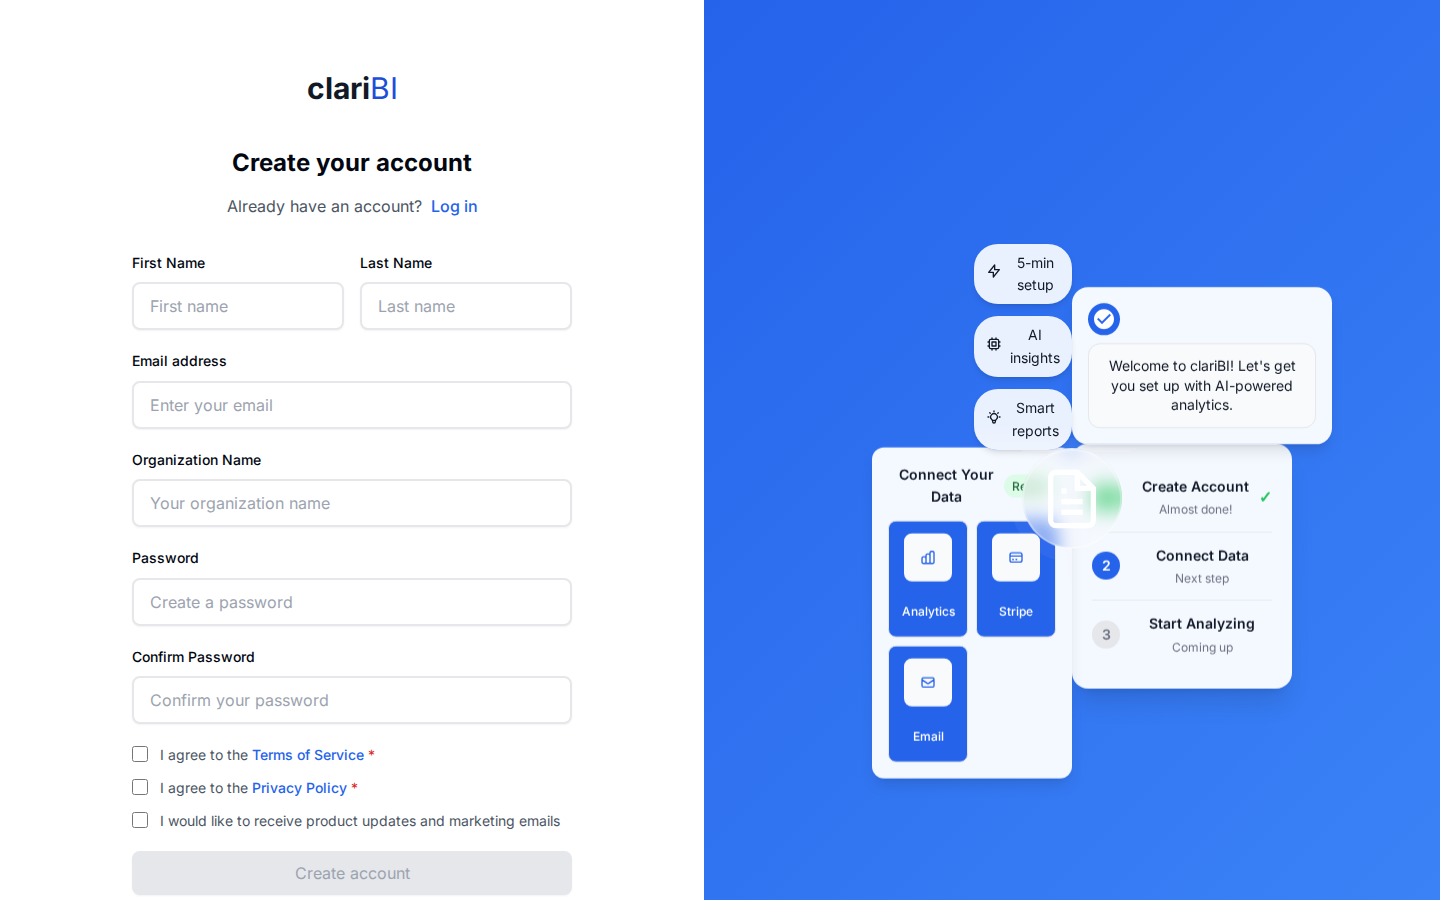
The most important evaluation metric is: how long does it take from account creation to a working dashboard with your real data? Not demo data, not sample data - your actual business data from your actual systems.
If the answer is more than one day for a basic dashboard, the tool is too complex for a 50-person company without a dedicated BI person. You need something that a reasonably technical person (product manager, marketing ops, finance lead) can set up in hours, not weeks.
During evaluation, run this test with your own data. Do not accept the vendor's demo as evidence. The demo always looks great because it was built by a product expert with clean data.
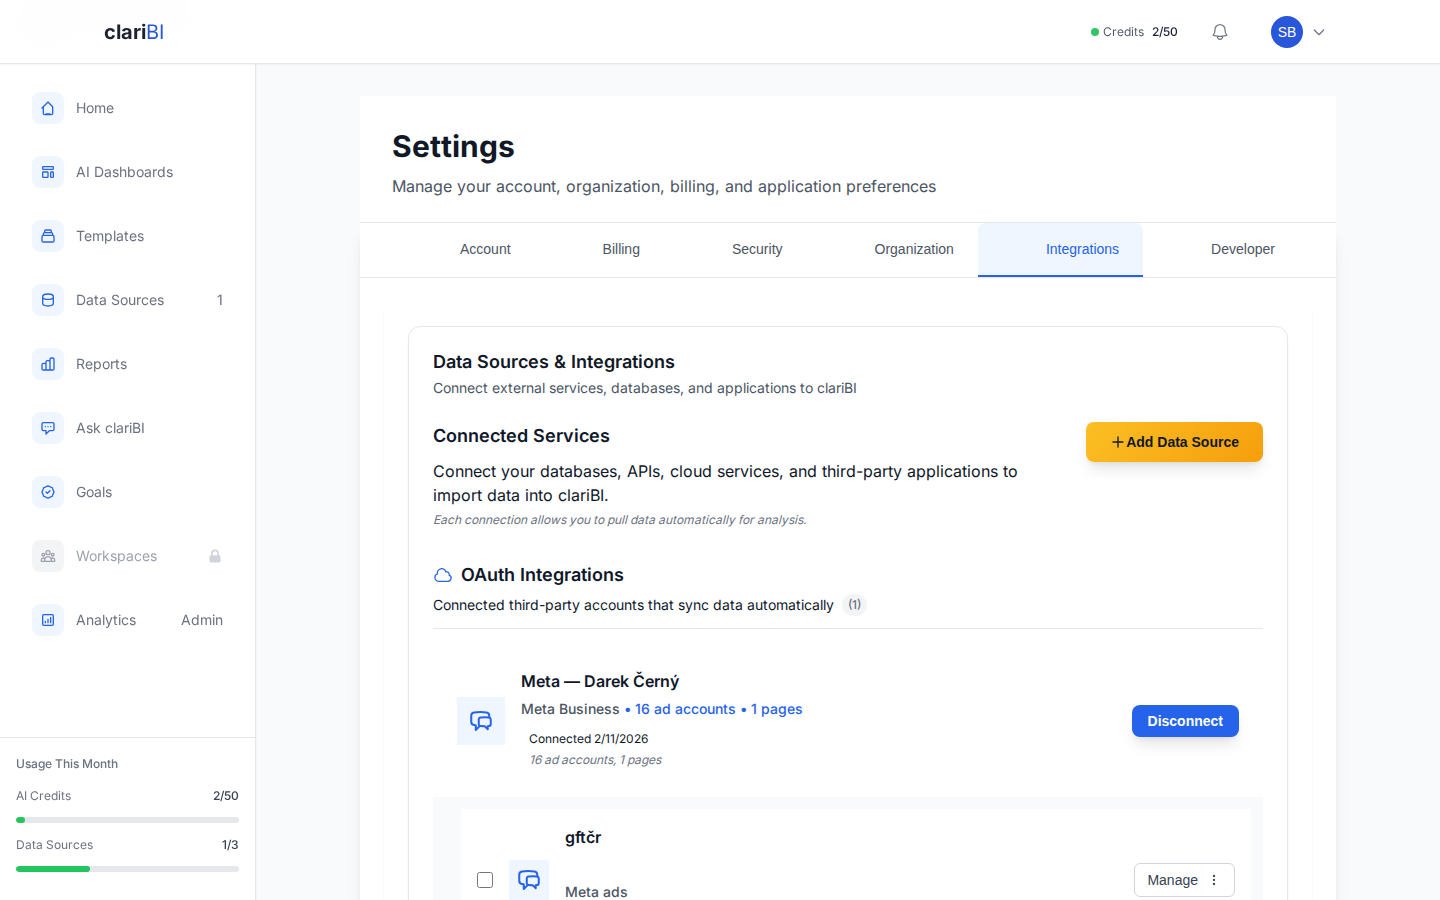
2. Data Source Connectivity
List every system you need data from. At 50 people, this typically includes:
- A database (PostgreSQL, MySQL, or similar)
- A CRM (Salesforce, HubSpot)
- A billing system (Stripe, Chargebee, QuickBooks)
- Spreadsheets and CSVs (the data that lives nowhere else)
- Possibly a product analytics tool (Mixpanel, Amplitude)
Verify that the BI tool connects natively to each of these. "We support 200+ connectors" on a marketing page means nothing if your specific Stripe API version or your self-hosted PostgreSQL instance is not actually supported. Test each connection during the trial.
3. Learning Curve for Non-Technical Users
At a 50-person company, the people who need data most - the VP of Sales, the Head of Marketing, the CFO - are unlikely to know SQL. The tool must be usable by people who think in business terms, not database terms.
Evaluate this by having a non-technical team member attempt to build a simple chart during the trial. If they cannot create a bar chart of monthly revenue by product line within 30 minutes without help, the tool fails this criterion.
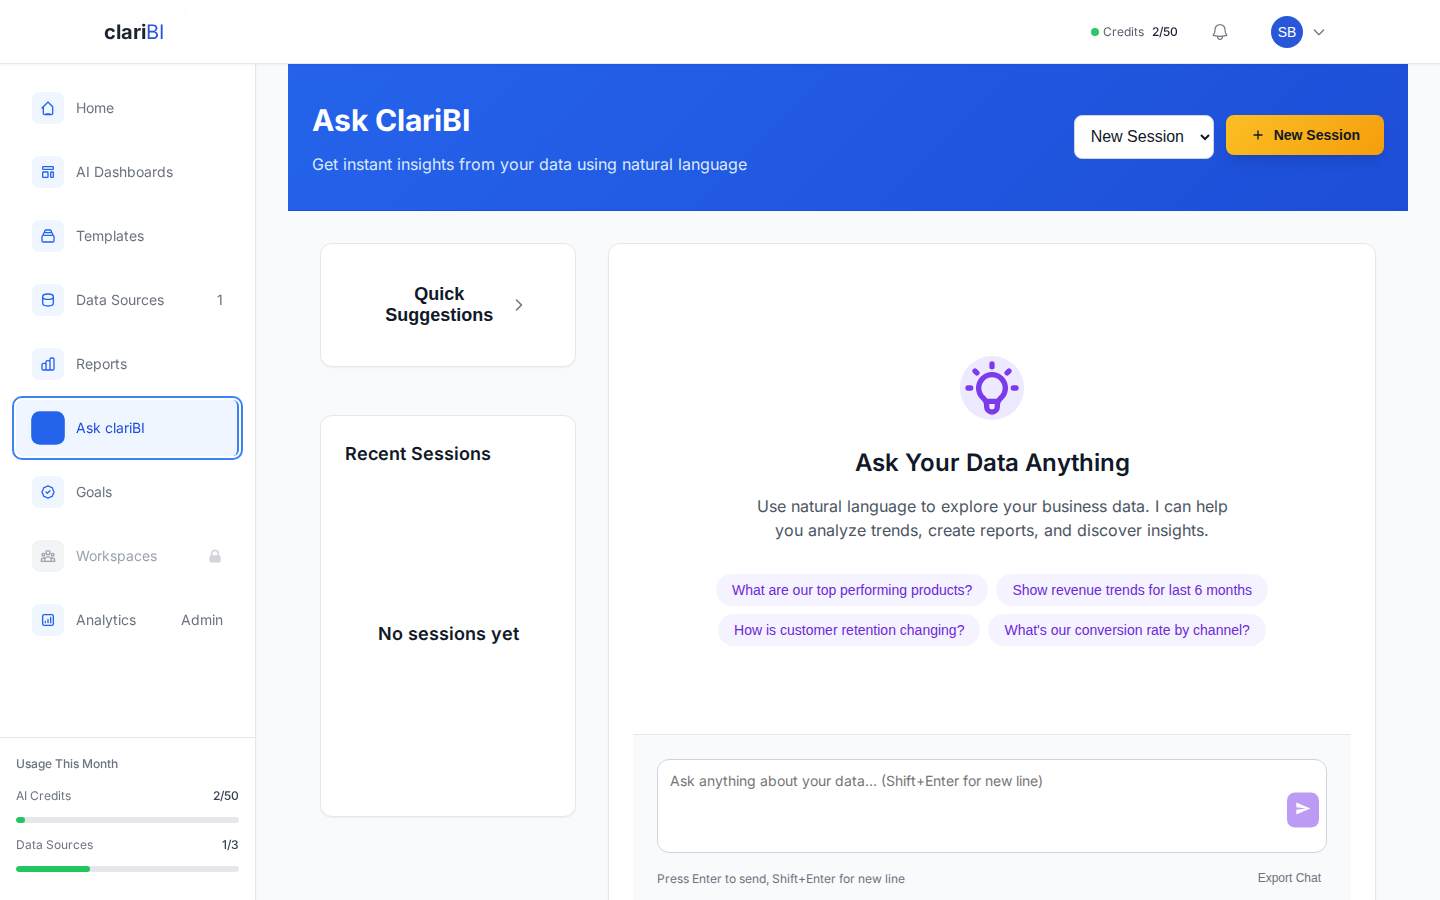
Tools with natural language query capability - like clariBI's conversational AI interface - particularly shine here. Asking "What was our revenue by product line each month this year?" in plain English eliminates the learning curve entirely.
4. Total Cost of Ownership
The license fee is usually the smallest part of the total cost. Factor in:
- License/subscription: Monthly or annual fee. Check per-user versus per-organization pricing. Per-user pricing gets expensive fast as you grow.
- Implementation time: Hours your team spends setting up data connections, building initial dashboards, and configuring the tool. At a 50-person company, this is usually someone's side project on top of their real job. Estimate 20-80 hours depending on tool complexity.
- Training: Time to train users. Simple tools need 1-2 hours. Complex tools need formal training sessions and ongoing support.
- Ongoing maintenance: Someone needs to fix broken data connections, update dashboards when data models change, manage user access, and answer "how do I do X?" questions. Budget 2-5 hours per week.
- Opportunity cost of delays: If a complex tool takes 3 months to deploy versus a simpler tool that deploys in 2 weeks, that is 10 weeks of decisions made without data. What is that worth?
5. Growth Headroom
You are 50 people now, but you might be 200 in two years. Evaluate whether the tool can grow with you:
- Can it handle 10x the data volume without performance degradation?
- Does it support role-based access control for when you need to restrict data by department?
- Can you create multiple dashboards for different audiences without rebuilding everything?
- Is there an API for embedding analytics into your own product if that becomes relevant?
You do not need enterprise features today, but migrating BI tools is extremely painful. Choose something that will not force a switch at 150 people.
Common Evaluation Traps
Trap 1: The Feature Checklist
Comparing tools by counting features is misleading. A tool with 50 chart types, 12 data transformation options, and 8 export formats might sound better than one with 15 chart types and 3 export formats. But if you only use 5 chart types and 1 export format, the additional complexity is a liability, not an asset. Evaluate on what you will actually use in the next 12 months.
Trap 2: Evaluating on Demo Data
Vendor demos use clean, well-structured data that makes everything look easy. Your data has nulls, inconsistent formatting, duplicate records, and weird edge cases. Always evaluate with your own data. The moment of truth is when the tool encounters your messy reality.
Trap 3: Letting IT Choose Without Business Input
IT evaluates on technical criteria: security, infrastructure compatibility, API quality. These matter, but they are not sufficient. The people who will use the tool daily - business users - must be involved in the evaluation. A technically excellent tool that business users refuse to use delivers zero value.
Trap 4: Overthinking the Decision
Some companies spend 6 months evaluating BI tools. During those 6 months, decisions continue to be made on gut instinct and stale spreadsheets. Set a 4-week evaluation timeline: 1 week to shortlist, 2 weeks to trial with real data, 1 week to decide. The cost of delay almost always exceeds the cost of picking a slightly suboptimal tool.
Running a Meaningful Trial
Here is a concrete trial protocol that produces a clear decision:
Week 1: Setup and Core Dashboard
- Connect your 2-3 most important data sources
- Build one dashboard that your CEO would actually use - revenue metrics, customer metrics, and one operational metric
- Time the entire process from sign-up to finished dashboard
- Note every point where you got stuck, needed documentation, or called support
Week 2: Business User Test
- Give a non-technical business user access to the dashboard you built
- Ask them to answer 5 specific business questions using the tool (write these down in advance)
- Observe without helping. Note where they struggle, where they get confused, and where they succeed
- Ask them: "Would you use this tool weekly to answer your own data questions?"
Decision Criteria
Score each tool on these five dimensions (1-5 scale):
- Setup speed: How quickly did you get from zero to a working dashboard with real data?
- Usability: Could a non-technical user answer questions independently?
- Data connectivity: Did your data sources connect without workarounds?
- Accuracy: Did the numbers match what you know to be true from your source systems?
- Satisfaction: Would you enjoy using this tool every week?
The tool with the highest total score wins. Tie-break on usability, because that determines adoption, and adoption determines ROI.
What to Expect From clariBI
clariBI is designed for exactly this company stage. Specific features that address 50-person company needs:
- Fast setup: Connect a PostgreSQL database or upload a CSV and build a dashboard in under an hour. No data engineering required.
- Natural language queries: Business users ask questions in English and get charts and tables. No SQL needed.
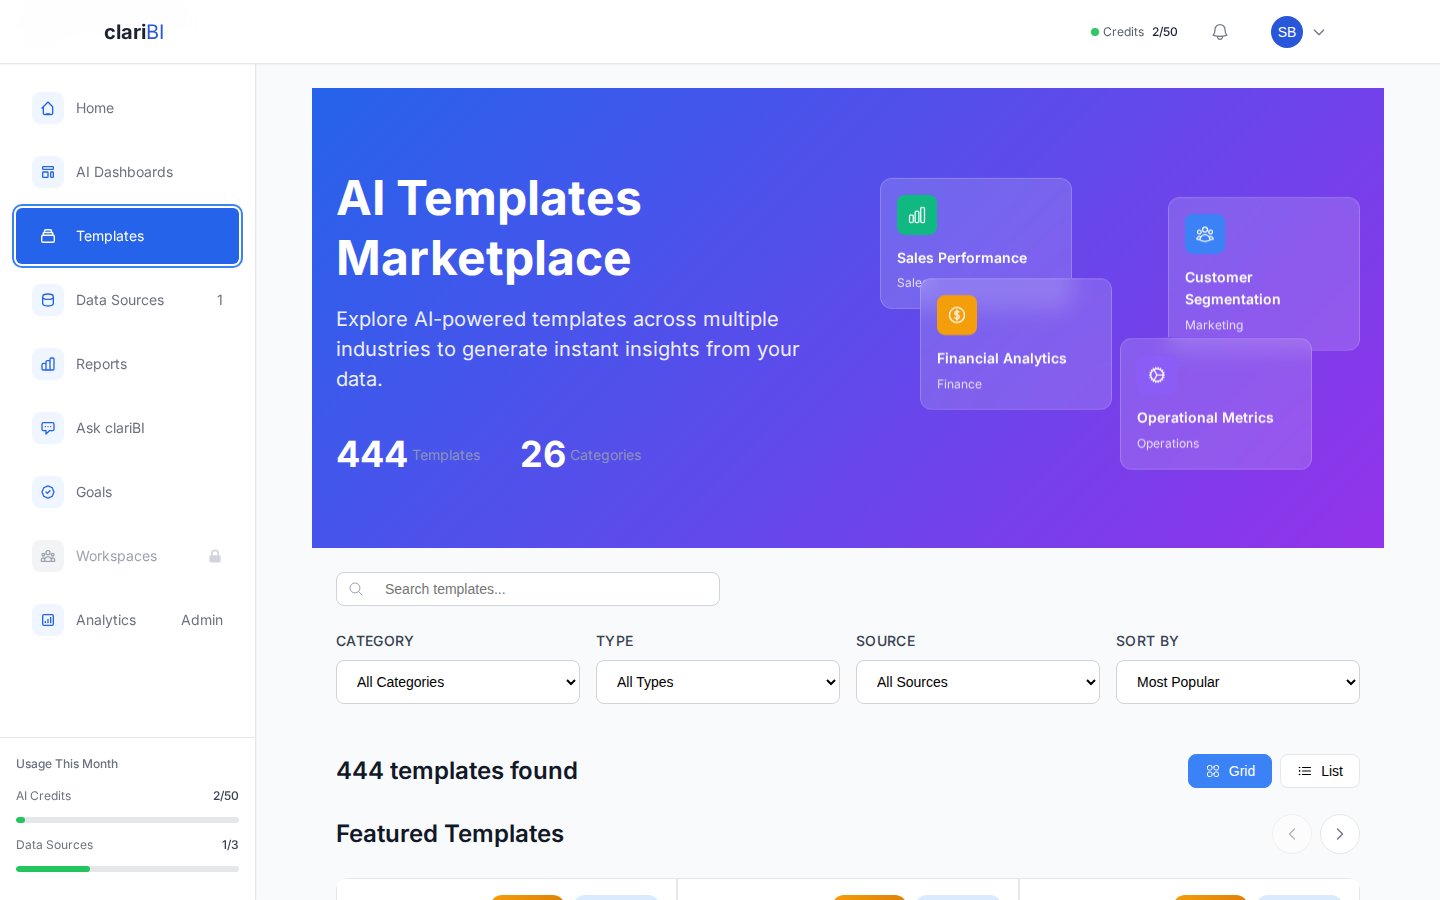
- Pre-built templates: Nearly 250 dashboard templates across industries and functions. Start with a template and customize instead of building from scratch.
- Affordable pricing: Subscription tiers starting at $99/month for small teams, scaling to enterprise as you grow. See the pricing page for details.
- RBAC that grows with you: Start with simple sharing; add role-based access control when you need it.
The right BI tool for a 50-person company is one that delivers value in the first week, does not require a full-time administrator, and grows with you. Optimize for speed to value and ease of use over feature count. The goal is better decisions, not a more impressive technology stack.