Every company eventually arrives at the same painful meeting: two departments present the same metric with different numbers, and nobody can explain why. Revenue is $4.2M according to Finance, $4.5M according to Sales, and $3.9M according to the CEO's spreadsheet. This is the moment organizations realize they need a single source of truth. Here is how to actually build one.
What a Single Source of Truth Really Means
A single source of truth (SSOT) is not one giant database that holds everything. It is an agreement across the organization about where the authoritative version of each metric lives, how it is calculated, and who is responsible for its accuracy.
An SSOT system has three properties:
- Definitive: There is exactly one official definition for each business metric, documented and accessible to everyone.
- Authoritative: When numbers conflict, people know which source wins and why.
- Current: The official numbers are updated frequently enough to support the decisions that depend on them.
Building this is not primarily a technology problem. It is an organizational problem with a technology component. The hard part is getting people to agree on definitions and give up their personal spreadsheets.
Phase 1: Audit What Exists
Before building anything, map the current landscape. This is tedious but essential.
Step 1: Inventory Your Metrics
Create a spreadsheet with every metric that gets reported regularly. For each metric, record:
- Metric name (and any aliases - "revenue," "bookings," "billings" may or may not mean the same thing)
- Who reports it and to whom
- Where the data comes from (which system, which table, which report)
- How it is calculated (the actual formula, not just "revenue minus costs")
- How frequently it is updated
- Known issues or caveats
You will likely discover that your company tracks 50-200 metrics across various departments, with significant overlap and inconsistency. That is normal. The inventory is the first step toward sorting it out.
Step 2: Identify Conflicts
Compare definitions across departments. Common conflicts include:
- Revenue definitions: Bookings vs. recognized revenue vs. billings vs. ARR. Finance, Sales, and the CEO often each use a different one without realizing it.
- Customer count: Total accounts vs. active accounts vs. paying accounts vs. accounts with at least one login this month. Each count serves a different purpose, but they get conflated regularly.
- Time period boundaries: Is "Q3" calendar quarter or fiscal quarter? Is "this month" the current month so far, or the most recently completed month?
- Inclusion/exclusion rules: Does "churn" include customers on pause? Does "MRR" include customers on annual plans?
Step 3: Identify the Source Systems
For each metric, trace the data back to its system of record. Revenue should come from the billing system, not from a Sales spreadsheet that mirrors the billing system with a two-week lag. Customer counts should come from the customer database, not from a marketing list that was last cleaned six months ago.
Phase 2: Define and Document
This is the phase where you build the agreement. It requires input from every department and sign-off from leadership.
Step 4: Create a Metric Dictionary
For each metric that survives the audit, write a formal definition that includes:
- Official name: The canonical name used in all reports and dashboards.
- Definition: A plain-English description of what this metric measures.
- Formula: The exact calculation, including edge cases. "Revenue" is not a formula. "Sum of all invoice line items with status = 'paid' or 'pending', excluding refunds, credits, and one-time setup fees, normalized to monthly for annual contracts" is a formula.
- Source system: Which system provides the authoritative data.
- Owner: The person responsible for the accuracy of this metric.
- Update frequency: How often the metric refreshes.
- Known limitations: What this metric does not capture or where it might be misleading.

Step 5: Get Cross-Functional Agreement
This is the hardest step. Schedule a working session with representatives from Finance, Sales, Marketing, Product, and Operations. Walk through each metric definition. Expect disagreements. That is the point - these disagreements have been happening silently for years, causing different numbers in different reports. Now you are making them explicit and resolving them.
Ground rules for the session:
- The goal is one definition per metric, not multiple versions labeled by department.
- If a department needs a different cut of the data, that is a filtered view, not a different metric.
- Finance wins ties on financial metrics. Product wins ties on usage metrics. The CEO breaks deadlocks.
- Document every decision and the reasoning behind it. People will forget or disagree later, and the documentation is your reference.
Step 6: Publish the Dictionary
Make the metric dictionary accessible to everyone in the company. This is not a document that lives in someone's personal Drive folder. It should be linked from your BI tool, your internal wiki, and your onboarding materials.
Phase 3: Build the Infrastructure
Step 7: Centralize Data Connections
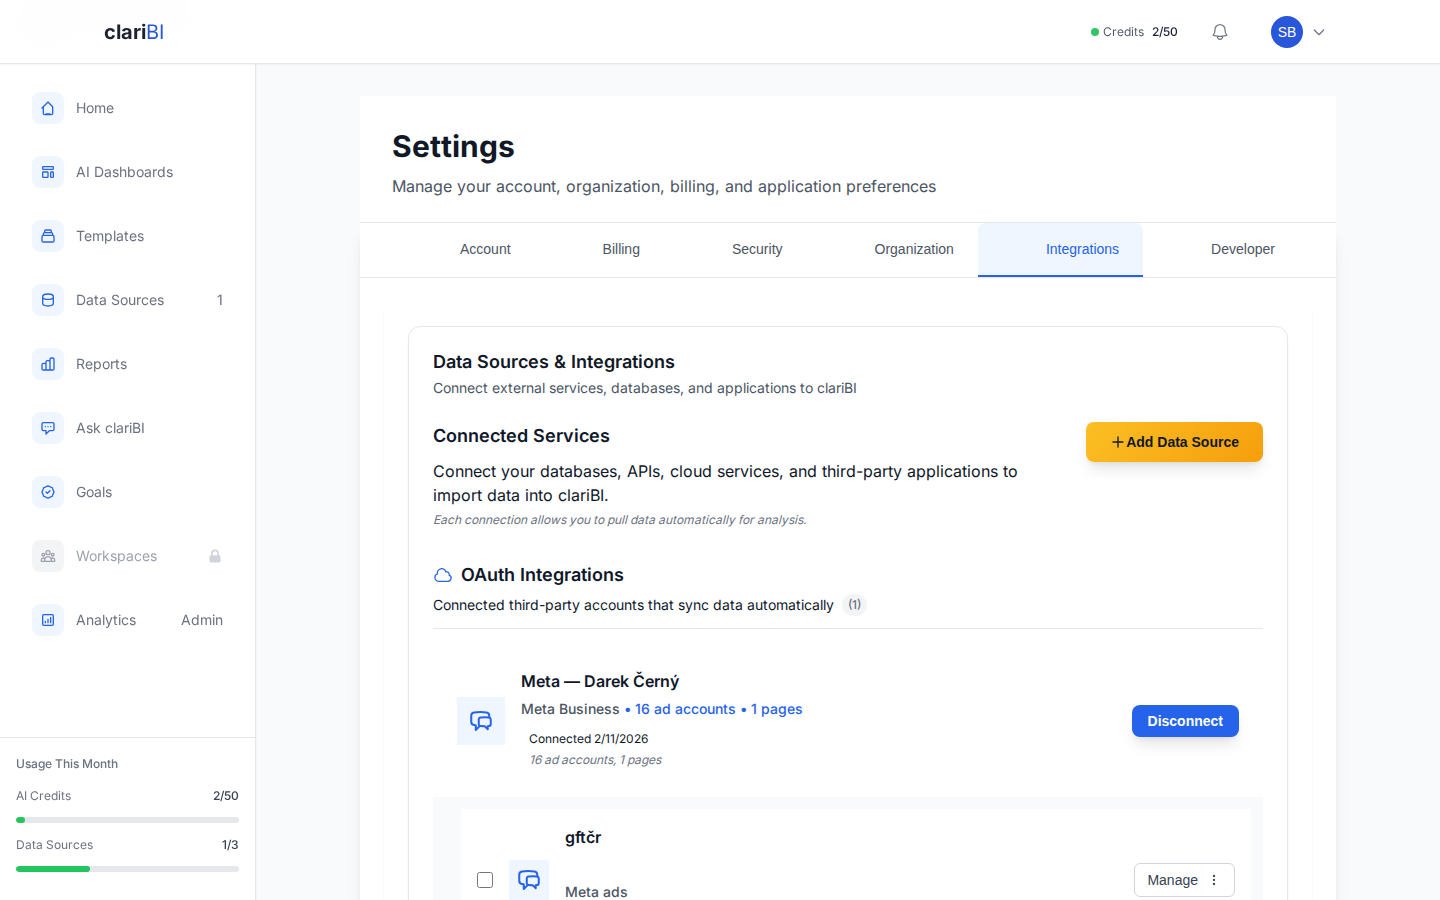
Connect your source systems to a central analytics platform. In clariBI, this means connecting your databases, billing systems, CRM, and other tools as data sources. Each connection pulls data from the system of record - the source that the metric dictionary designates as authoritative.
This step eliminates the most common source of conflicting numbers: different people querying different copies of the data with different freshness. When everyone accesses the same data through the same tool, one category of discrepancies disappears entirely.
See the data source connection guide for instructions on connecting each type of source.
Step 8: Build the Official Dashboards
Create a set of certified dashboards that implement the metric definitions from your dictionary. These dashboards are the visual representation of your SSOT. Label them clearly as "Official" or "Certified" so users can distinguish them from exploratory analyses.
Core certified dashboards typically include:
- Executive scorecard - the 5-7 metrics the leadership team reviews weekly
- Financial dashboard - revenue, costs, margins, cash position as defined by Finance
- Sales dashboard - pipeline, bookings, win rate, quota attainment as defined by Sales leadership
- Product dashboard - usage metrics, adoption, engagement as defined by Product
- Customer health dashboard - retention, NPS, support metrics as defined by Customer Success

Step 9: Implement Access Controls
Not everyone needs access to everything. Configure role-based access so that:
- Everyone can view the certified dashboards relevant to their role
- Department leads can explore data within their domain using self-service features
- Only the analytics team can modify certified dashboards and metric definitions
- Sensitive data (compensation, individual customer financials) is restricted to authorized roles
clariBI's RBAC system supports five permission tiers from Viewer to Owner, with granular control over who can view, edit, create, and share content. See the RBAC documentation for configuration details.
Phase 4: Drive Adoption
Building the SSOT is half the battle. Getting people to actually use it is the other half.
Step 10: Retire Competing Reports
Identify the spreadsheets, emails, and shadow reports that currently compete with your SSOT. Work with their owners to either retire them or replace them with links to the official dashboards. This is politically sensitive - people are attached to their spreadsheets - but it is necessary. Every competing report is a potential source of conflicting numbers.
Step 11: Integrate Into Workflows
The SSOT should show up where people already work:
- Embed the executive scorecard into the weekly business review agenda
- Set up automated reports that deliver to email and Slack on schedule
- Link dashboards from meeting agendas and board decks
- Include dashboard links in the onboarding process for new employees
Step 12: Train and Support
Run training sessions for each department showing them how to access their certified dashboards, how to use self-service exploration within governed data models, and whom to contact when they have questions or find data issues.
Phase 5: Maintain Over Time
An SSOT is not a one-time project. It requires ongoing maintenance.
Quarterly Metric Reviews
Every quarter, review the metric dictionary with stakeholders. Business priorities change, new metrics become relevant, and old ones may become obsolete. Add new metrics through the formal definition process rather than letting people create ad-hoc definitions.
Data Quality Monitoring
Set up automated checks that flag data quality issues: missing data, unexpected nulls, values outside expected ranges, broken data connections. In clariBI, data source health monitoring alerts you when a connection fails or data freshness drops below a threshold. Catch problems before users discover them.
Change Management
When metric definitions change - and they will - communicate the change proactively. Document what changed, why, and how it affects historical comparisons. A metric definition change that is not communicated creates exactly the kind of confusion the SSOT was built to prevent.
Common Pitfalls
Trying to Boil the Ocean
You do not need to define every metric on day one. Start with the 10-15 metrics that appear in leadership meetings and cause the most frequent disagreements. Get those right, prove the value, then expand.
Treating It as a Technology Project
Buying a BI tool does not create an SSOT. The tool is the delivery mechanism. The SSOT is the agreement about what the numbers mean, where they come from, and who owns them. Get the agreement first, then configure the tool to enforce it.
No Governance After Launch
Without ongoing governance, the SSOT degrades over time. People create new metrics outside the process. Data connections break and nobody notices. Definitions drift. Assign a data steward or analytics lead who owns the ongoing health of the SSOT.
Perfection as the Enemy
The SSOT does not need to be perfect on day one. It needs to be better than the current state, which is usually "no agreement at all." Launch with good-enough definitions, monitor usage and feedback, and improve iteratively. A published, imperfect metric dictionary is infinitely more useful than a perfect one that never ships.
Measuring Success
How do you know your SSOT is working? Track these indicators:
- Conflicting numbers in meetings decrease. If the "which number is right?" debate stops happening, you are succeeding.
- Dashboard adoption increases. Track how many people access the certified dashboards weekly. Growth means people trust the data.
- Ad-hoc report requests decrease. If the analytics team spends less time pulling one-off reports, self-service on the governed layer is working.
- Decision speed increases. If leadership makes decisions faster because they trust the numbers, the SSOT is delivering its core value.
Building a single source of truth is one of the highest-impact investments a data team can make. It is not glamorous work - metric definitions and data governance do not generate excitement in all-hands meetings. But every other analytics initiative, from dashboards to AI-powered insights, depends on the data being correct and consistent. Get the foundation right, and everything built on top of it becomes more valuable.