Setting goals is easy. Tracking them honestly is hard. Most companies set ambitious quarterly targets, put them in a slide deck, and do not revisit them until the next planning session - at which point they discover they missed most of them. clariBI's goal tracking feature connects your goals directly to live data, so progress updates itself automatically and the gap between aspiration and reality is visible at all times.
Why Goals Need Live Data
Manual goal tracking - updating a spreadsheet once a week or reviewing progress in a monthly meeting - creates two problems:
- Lag: By the time you update the tracking spreadsheet, the data is already days old. If you are behind, you find out too late to course-correct.
- Optimism bias: When humans self-report progress, they tend to round up. "We're mostly on track" often means "we're 15% behind but I think we can catch up." Live data does not round up.
Connecting goals to live data solves both problems. The number on the screen is the number in the system - updated daily, no manual entry required, no room for interpretation.
Step 1: Define Your Goals
Before configuring anything in clariBI, write down your goals with enough specificity that they can be measured automatically. A measurable goal has four components:
- Metric: The specific number you are tracking (MRR, new customers, NPS score, feature adoption rate)
- Target value: The number you want to reach (e.g., $500K MRR, 200 new customers)
- Timeframe: When you want to reach it (end of Q2, December 31, 90 days from now)
- Starting value: Where you are today (this establishes the baseline for measuring progress)
Example Goals
| Goal | Metric | Starting Value | Target | Timeframe |
|---|---|---|---|---|
| Grow recurring revenue | MRR | $380K | $500K | End of Q4 |
| Reduce churn | Monthly gross churn rate | 3.2% | 2.0% | End of Q4 |
| Expand customer base | Active customers | 450 | 600 | End of Q4 |
| Improve customer satisfaction | NPS | 42 | 55 | End of Q2 |
Step 2: Set Up Goals in clariBI
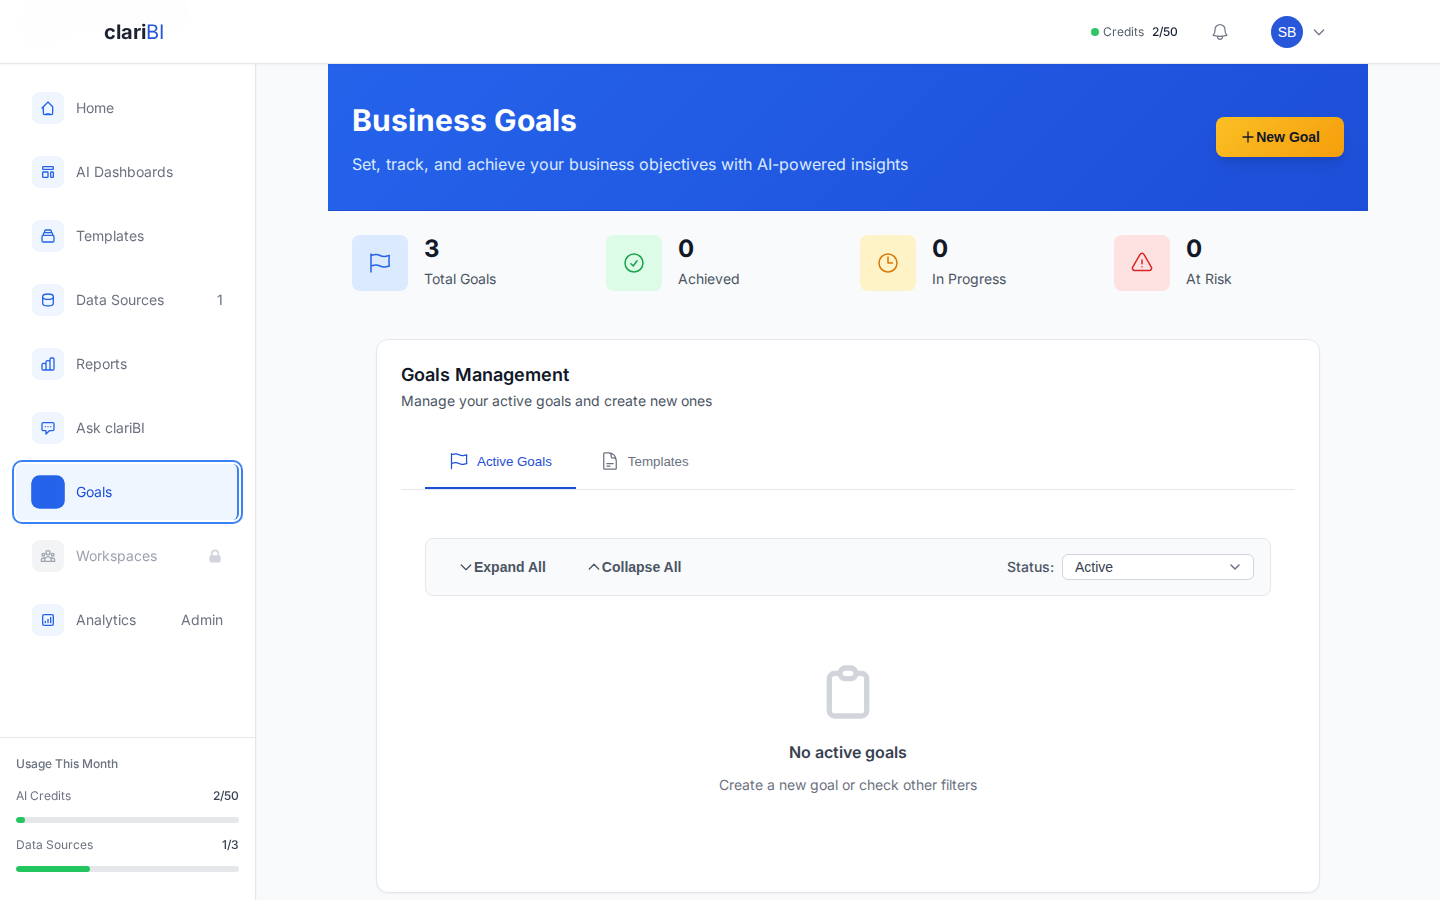
- Navigate to Goals in the left sidebar
- Click Create Goal
- Enter the goal name, description, and owner (the person accountable for this goal)
- Select the data source and metric that tracks this goal. For example, if tracking MRR, select your billing data source and configure the metric as "sum of monthly recurring revenue."
- Set the starting value, target value, and target date
- Click Save
clariBI will now automatically pull the current value of the metric from your data source and display progress as a percentage of the target.
Step 3: Add Milestones
Large goals benefit from intermediate milestones - checkpoints that let you assess whether you are on track before the final deadline.
- Open the goal you just created
- Click Add Milestone
- Set the milestone value and date
For the MRR goal ($380K to $500K by end of Q4):
- Milestone 1: $420K by end of Month 1 (on track for linear progress)
- Milestone 2: $460K by end of Month 2
- Milestone 3: $500K by end of Q4
Milestones serve as early warning signals. If you miss Milestone 1, you know immediately that the current trajectory will not reach the target without a change in approach. That early signal gives you time to adjust before the quarter is over.
Step 4: Add Goals to Your Dashboard
Goals are most effective when they are visible in the tools your team already uses. Add goal progress to your existing dashboards:
- Open the dashboard where you want to display goal progress
- Add a Goal Progress widget
- Select the goals to display
- Configure the display: progress bar, percentage, or progress-against-time chart
The progress-against-time chart is particularly useful. It shows two lines: the expected trajectory (linear path from start to target) and the actual trajectory (where the metric currently sits). When the actual line is above expected, you are ahead of plan. When it is below, you are behind.
Adding goals to your executive dashboard (see the executive dashboard guide) keeps them in front of leadership during every review. Adding them to team dashboards keeps them in front of the people doing the work.
Step 5: Configure Notifications
Set up notifications to stay informed without checking the dashboard constantly:
- Milestone reached: Get notified when the metric crosses a milestone value. Celebrate the win.
- Off-track alert: Get notified when progress falls behind the expected trajectory by more than a threshold (e.g., more than 10% behind expected pace).
- Goal achieved: Get notified when the target is reached.
Keep notification volume low. If every small fluctuation triggers an alert, people will start ignoring them. Reserve alerts for meaningful events: milestones hit, significant off-track deviations, and goal completion.
Using Goals in Team Meetings
Weekly Check-In
In your weekly business review, include a 2-minute goal check:
- Are we on pace for each goal? (Green/yellow/red status at a glance)
- Any milestones coming up in the next 2 weeks?
- Any goals that are off track? What is the recovery plan?
Monthly Deep-Dive
Once a month, review goals in more detail:
- What drove progress this month? (Identify the actions and conditions that moved the number)
- What blocked progress? (Identify obstacles to address)
- Should the target be adjusted? (If market conditions changed dramatically, it may be more honest to adjust than to chase an impossible number)
- What will we do differently next month? (Specific actions, owners, and timelines)
OKR Integration
If your company uses OKRs (Objectives and Key Results), clariBI's goal tracking maps directly:
- Objective: Becomes the goal name and description (e.g., "Become the market leader in mid-market BI")
- Key Results: Each becomes a separate goal with its own metric, target, and milestones
- KR1: Grow MRR to $500K by Q4
- KR2: Achieve NPS of 55 by Q2
- KR3: Reduce churn to 2% monthly by Q4
Group related goals together so the leadership team can see overall objective progress at a glance: if 2 of 3 key results are on track, the objective is likely achievable.
Common Goal Tracking Mistakes
Setting Goals Without Owners
A goal that belongs to "the team" belongs to nobody. Every goal needs one person who is accountable for progress and responsible for reporting on it. That person does not have to do all the work, but they need to own the outcome.
Ignoring Goals That Are Off Track
The purpose of live tracking is early intervention. If a goal is 20% behind pace in Month 1, do not wait until Month 3 to discuss it. Diagnose the problem, decide on a corrective action, and implement it immediately.
Too Many Goals
If everything is a priority, nothing is a priority. Limit active goals to 3-5 at the company level. Each team might have 2-3 additional goals. If you have 20 active goals, you are not focused - you are making a wish list.
Not Connecting Goals to Actions
A goal without a plan is a hope. When you set a goal, also define the 3-5 specific initiatives that will drive progress. Track both the goal metric and the leading indicators that tell you whether the initiatives are working before the goal metric moves.
Goal tracking with live data removes the ambiguity from performance management. The number is what the number is. There is no spin, no creative interpretation, no "we'll catch up next month" without evidence. That transparency is uncomfortable at first but invaluable over time - it forces honest conversations about priorities, resources, and execution that lead to better outcomes.